3 types of Chart Styles
In this article, we’ll explain 3 types of Chart styles used in all kinds of trading market – forex market, stock market, commodity market, bond market etc.
3 types of Chart Styles
- Candlestick Chart
- Bar Chart
- Line Chart
Now, let us see above-mentioned charts in detail. As an example, the same chart is used in 3 different ways. The chart is USDJPY forex currency pair on daily time frame.
Candlestick Chart
Candlestick is a chart style born in Japan, but now it is widely used in the West as a candle chart (or candlestick chart) in the West. It is characterized by 4 values (open price, high price, low price, close price) visually easy to grasp. Methods for analyzing individual candle shapes and contexts are also widely used.
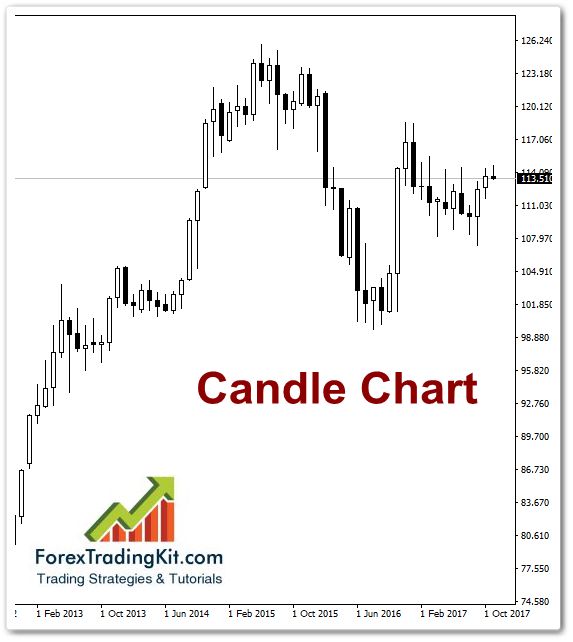
The interesting thing is that the sense of color is different between Japan and the West. Normally, in Japan, when the closing price ends higher than the opening price, it draws in red (this is called positive line), when it finishes cheaply it draws in blue (hidden line). In Europe and the US use green or blue when rising and red when going down. Red is a color that is congratulatory in Japan, but in Europe and America, it is a color that represents caution and danger. In addition, when monochrome is used, the rise will be white and the descent will be black for the world.
Advantages and disadvantages of the candlestick charts
The advantage lies in the fast visual capture and the simultaneous comprehensive statements of a candle. There are traders who no longer look at any other representation.
Compared to traditional bar charts, many retailers see candlestick charts as more visually appealing and easier to interpret. Each candlestick offers an easy to interpret the image of a price action. The trader can immediately compare the relationship between opening and closing and high and low. The relationship between opening and closing is seen as important information and forms the essence of candlesticks.
The exciting thing about candlelight charts is that the candles themselves can serve as an indicator of future upward or downward movements and are therefore often part of their own trading strategy.
Unfortunately, some traders find the not so clear identification of opening and closing prices compared to the bar charts with entry and exit, although the candle actually represents these courses clearly by their body. Another drawback could result from the variety of over- and misinterpretations of the candlesticks that their fans set into the world.
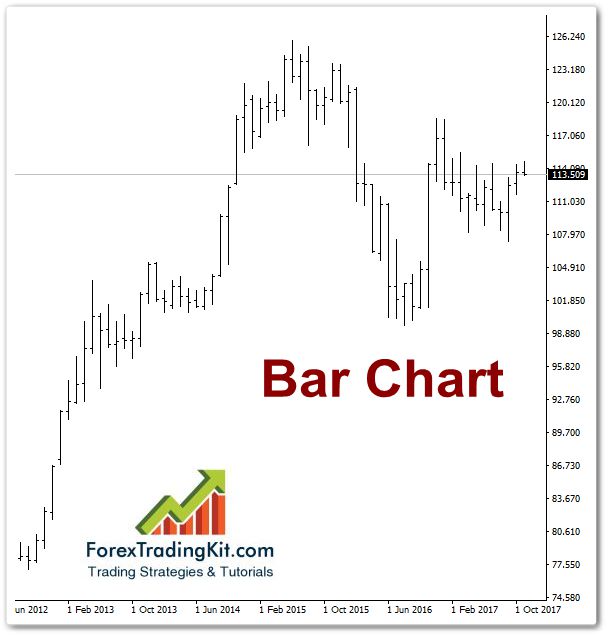
Bar Chart
In contrast to the line chart, the bar chart (also called bar chart OHLC ) gives you at a glance four important pieces of information for the considered time period:
- Opening price ( O pen)
- Highest price ( H igh)
- Low price ( L ow)
- Closing price ( C loose)
The bar chart is a chart style that is common in Europe and the United States. Like the candlestick, it is devised so that 4 values are known. Individual feet (vertical lines) represent high and low values as shown in the image, protrusions on the left side represent opening values, and protrusions on the right side represent closing prices. There is also a pattern of three values whose initial value is omitted. It is almost impossible to distinguish between positive and negative lines, but you may also see color-coded bar charts.
Bar Chart
Whether you use candlestick or bar chart is a matter of taste, candlesticks require a certain horizontal width to draw a single leg, so bar charts have a lot more in the limited screen There are merits to draw. Also, the candlestick emphasizes the opening and closing prices, so if you want to pay attention to the value range you just moved, a bar chart would be a good idea.
Due to the variable length of the bars, even strong fluctuations in the price trend are immediately visible.
In terms of information provision, the bar chart thus has its nose clearly ahead of the line chart due to its graphical representation.
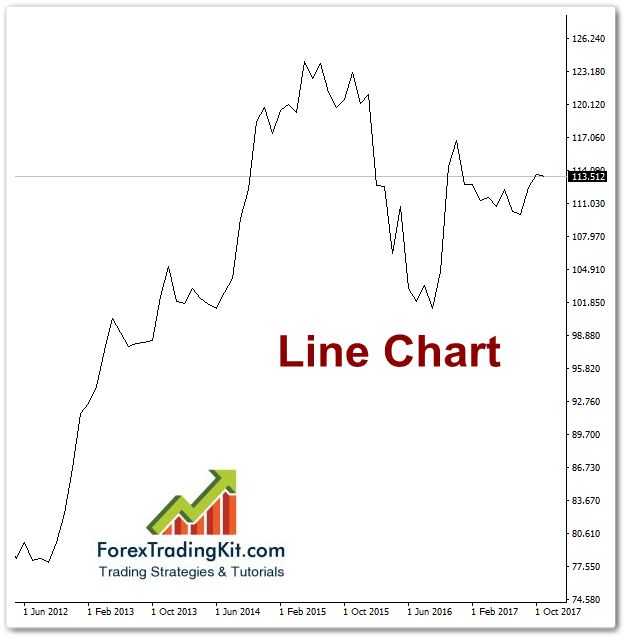
Line Chart
Line Chart
A line chart is a line graph showing the closing price (which may take the opening price or the medium price). Although information volume is inferior to candlestick feet and bar charts, it is simple and easy to see style.
Advantages and Disadvantages of Line Chart
The line chart is often the first choice for newcomers and stockbrokers because it shows at a glance whether the underlying asset is currently falling or rising.
The disadvantage of this chart representation is quickly clear: For more than the information on the closing prices this chart type does not provide. He completely ignores statements regarding strong supply or demand fluctuations. The informative value of the line charts is therefore very limited.
For investors whose strategy is based solely on trading of closing prices, the line chart is certainly very useful. Investors who are looking for further information from their chart picture will not be happy with the chart.
Which Chart Style should you use?
Just consider pros and cons of each chart style.
Line chart just shows line in a chart, whereas bar chart shows value range.
And above all, Japanese Candlestick chart shows tons of information on a single chart. Each candle represents the trend. So, combining candlestick chart with technical indicators like MACD, Doda Donchian, ADX, RSI, Stochastic etc. means, you can forecast future of trend. Almost every professional & successful traders use candlestick charts and pay attention to different patterns they formed.
Now, if we assume that technical analysts are what they see in a chart, it becomes clear that the highly complex presentation of the price history in the form of candlelight charts provides you with the highest quality information both quantitatively and qualitatively at a glance!
Therefore, it is not surprising that candle charts probably represent the most popular method of analysis worldwide. And even I hardly know a professional who does not rely on the validity of the candles.
It may require some time to learn and to gain experience, but you’ll surely learn.
We’ll use Candlestick charts on this website – almost everywhere.
You can find lots of tutorials and guide to learn the art of forex trading on this website and on DodaCharts.com