50 basic combinations of Japanese Candles
When determining the reversal signals, the investor can use various instruments of technical analysis: oscillators, trend indicators, support and resistance levels. But, in addition, a variety of candle combinations are useful tools that can be used in combination with the above methods. Candlestick analysis can provide answers to the question of what moods in the market, because each candle is a struggle between buyers and sellers. In this article, we would like to present you the main candle combinations that will help to predict a turn on a bull or vice versa bear market or a continuation of the trend.
Japanese candles as a tool for technical analysis was invented before the others, but the wide application was not immediately obtained. By name, it’s easy to guess that Japan became the “motherland”: local rice traders used this method already in the 18th century. It is believed that for the first time a chart in the form of a sequence of “candles” was invented by the Homma Munahis rice merchant to visualize the price maximum and minimum for a certain period of time, as well as the prices for the beginning and the end of this period. However, due to geographical remoteness and closeness of Japan from external “visitors”, this type of graphics became popular much later, when the exchange life was actively boiling in Europe and the United States. According to the absolute majority of experts, “Japanese candles” can be called the most convenient schedule – it shows not only the direction of movement,
Combinations confirming the reversal of the “bearish trend”
The first combination, which we will consider, is a hammer and an inverted hammer. The hammer has a big shadow at the bottom and a small white body at the top, and the inverted hammer is a big shadow up and a small black body underneath. It appears, like all subsequent combinations, at the bottom of the downtrend.
 hammer | 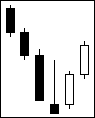 inverted hammer |
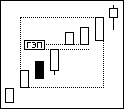
“Bull Harami” consists of two candles: the first with a long black body that covers the second with a short white body. A distinctive feature is that this model assumes a price gap. The fact that “harami” in translation from Japanese means pregnant, so if you look closely at the picture, you can see that the body of the right candle is located inside the body of the left candle.
Bull Harami
If, on the contrary, the first appears a short black body, and then a long white body, it means a combination of “bullish absorption“.
bullish absorption
These were the most common combinations. Now consider the more rare.
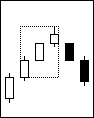
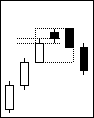
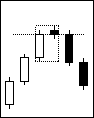
Short candles in the “star position”. “Star” is a candle with a fairly small body, formed after the break with the closure of the previous candle, usually with a large body. Therefore, in this model the candle should appear at the bottom of the downward trend, have a short body and open with a gap down compared to the previous candle. The third black candle with a short body should close higher than the first candle.
star position
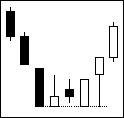
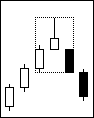
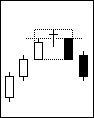
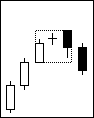
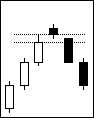
“Morning Star in Three – Candle Position“. Here the first candle should be black, denoting a strong downward movement, the second has a short body and is formed with a gap relative to the feather candle, and the third candle is necessarily white, at which the price has risen to at least half the body of the first candle. Ideally, the morning star should have a gap before and after the second candle, however, the gap between the second and third candles is rare.
Morning Star in Three
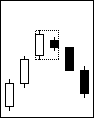
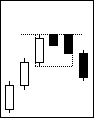
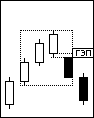
A short candle in the “harami” position. This combination is similar to the “bull hara“, which we described earlier, only in this case the second candle is short and black, but it is also in the body of the first candle. The third candle is necessarily white.
short candle in the “harami” position
Japanese candles “Doji” are candles that have either a very narrow body or a body that represents a line (the opening price is equal to the closing price is the ideal case), and the shadows are long enough. Pay special attention when the doji stands among the candles with long bodies, as it can foreshadow the trend reversal.
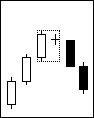
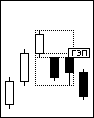
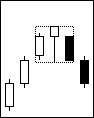
One of the combinations with such a candle is the doji in a “stellar position.” In fact, it’s the same thing as short candles in a “stellar position”, only “dodges” come to replace short candles. If after the formation of the “Dodge” in the “star position” prices open with a gap against the trend, then we can safely say that the uncertain market situation on the day of the formation of “Dodge” ended in the victory of bulls.
doji in a “stellar position.”
The cross is “harami”. Here everything is simple: in place of the second candle in the “harami” position is located dodge. “Cross Harami” consists of two candles. The first candle has a long body, and the second is a doji. The second candle is as if in the body of the first candle.
harami
Clearance in the clouds, or Piercing line. This combination consists of two candles, the first with a long black body, and the second with a long white body. At the same time, the white candle opens below the price of the black candle and closes above its middle. The stronger the second body “penetrates” into the first, the higher the chances that it is a strong signal about a trend reversal.
Piercing line
“Double push”. In this model, white candles seem to push upward downward dynamics. The first white candle should open below the low of the previous black candle, and close below the middle of the black candle. If in a downward trend, this situation is repeated twice, you can expect a reversal.
Double push
Tweezers are formed from two or more candles that have the same minimums in a declining market, and they can be formed by bodies, shadows or doji. Their significance is higher after a long trend, but as a whole they give not a strong enough signal.
Tweezers
“Absorption” in combination with “hammer”. This combination consists of three candles. The first candle is a hammer, and the second and the third form the bullish absorption, which we described earlier.
Absorption
“Penetrating line in forceps” – this combination consists of two candles and, as you may have guessed, combines the forceps and the penetrating line.
Penetrating line in forceps
The bullish “abandoned child” consists of a long black candle, doji through a rupture, and a long white candle through a rupture, as shown in the figure.
abandoned child
Strong bottom, “fortress” is a strong range, which for some time keeps the quotes from the decline. Then the candle opens with a gap up, and the trend changes with the bull.
fortress
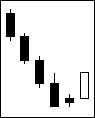
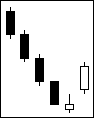
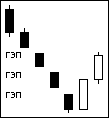
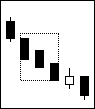
A quick breakthrough and three new bottoms. This combination consists of 3 black candles at the end of a downtrend, and before the first candle there is a break with the previous candle, and after the third candle there is also a gap before the first white candle.
three new bottoms
“Bull line of the meeting”. On the first day there is a black candle, and the second one is white, and the closing prices are the same or almost the same for both days.
Bull line of the meeting
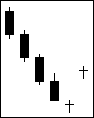
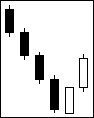
Triple gap on black candles. This model consists of 3 days of decline, each of which opens with a gap below the closing of the previous day. After three days of decline, the market becomes critically oversold and ready for a reversal.
Triple gap on black candles
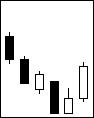
8-10 new bottoms. With a downward trend, candlesticks are counted with new lows and profit is recorded in the formation of reversal patterns or candles. If the correction formed 8-10 new lows, then this is the signal to a possible reversal, if less, then the count is reevaluated.
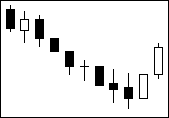
8-10 new bottoms
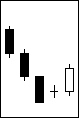
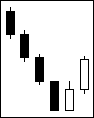
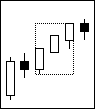
The Bullish Window. At the bottom of the downtrend appears a white candle that signals a possible reversal. The next day the market produces a strong upward movement, opening with a gap to the closing level of the previous day and confirming a trend change.
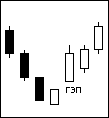
The Bullish Window
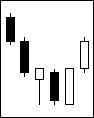
“Bull” game, ending with a gap (gap). This combination can be described as a frequent change in the mood in the market, which, in the end, ends up with a gap up and a reversal of the trend.
Bull game
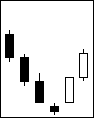
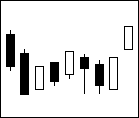
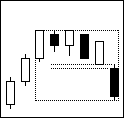
And so it looks like a combination of four previously listed formations: an inverted hammer, a “fortress”, a dodge and a “bullish absorption.”
combination of four
Combinations confirming the turn of the “bullish trend”
“Bear Harami” is the same as “bull haraami”, only a long white body should appear first, and short black – the second, and the body of the right candle is in the body of the left.
Bear Harami
“Bearish absorption.” Here the first is a short white candle, and the second is a long black candle, and if you look at it, the body of the left candle is inside the body of the right candle.
Bearish absorption
The “shooting star” is a short candle with the missing lower shadow and a very long upper one.
shooting star
Bearish cross “harami” is formed when the first candle is long and white, and the second candle (“child”) is a “doji”.
Bearish cross harami
“Three-linear star in thoughtfulness” or in another way “repulsed offensive of three white soldiers”. This combination reflects a gradual steady price increase and consists of three candles, the opening price of each of them being located within or adjacent to the previous white body. The price of closing candles is equal to the maximum prices or approaching them. If the second and third candles (or only the third candle) show signs of weakening, that is, their body is gradually decreasing or relatively long upper shadows are formed, then the model “repulsed offensive of three white soldiers” is formed. This model should be especially alarming if it appears after a long upward trend.
Three-linear star
“Southern evening cross” consists of three candles. The first candle should be with a white body and have a maximum above the maximum of the previous candle. The second should be doji, and the closing price should be higher than the maximum of the first candle. The third candle with a black body with an opening price equal to the maximum, and this maximum should be lower than the closing of the second candle.
Southern evening cross
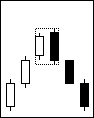
“Star turn” is a combination consisting of three candles, and the second candle should have a closing price with a gap to the maximum of the first candle. The third candle should have a black body and the opening price equal to the maximum, and this maximum should be higher or equal to the closing level of the second candle.
Star turn
Dodge in the position of “star turn” – the same combination as the “star turn” , only the second candle should be doji, and the third candle should open above the maximum of the doji.
Dodge in the position of star turn
“Bull tongs” are formed from two or more candles that have the same maximums in a growing market, and they can be formed by bodies, shadows or doji. Their significance is higher after a long trend, but on the whole they do not give a strong enough signal.
Bull tongs
“Bear’s Window” consists of 3 candles, and the market signals a reversal by changing the color to the second candle, which opens with a gap to the opening level of the previous day. The third candle opens roughly on the same level as the second candle and also has a black body.
Bear’s Window
Three-candle “evening star”. In this pattern, the second middle candle has a very small body, and the smaller the body, the more reliable the reversal signal. It opens through a gap to the level of closure of the previous candle. Color does not play a significant role. The third candle opens through a gap down to the closing level of the previous candle. It should close lower than the center of the first candle. A long black candle confirms the bearish mood of the market.
Three-candle “evening star”
“Bear” line of the meeting. On the first day there is a white candle, and in the second black, and the closing prices are the same or almost the same for both days. The third black candle opens at the level with the closing of the second candle.
“Bear” line of the meeting
“Bearish three-linear breakthrough and resistance line”
Bearish three-linear
“Hangman” is very similar to a hammer, but appears on a growing trend. It looks like a candle with a small body at the top and a long shadow at the bottom. The color of the body is not important, but there is no shadow on top of the body.
Hangman
“Bearish abandoned child” is the same combination as previously described by us, only not in a bearish trend, but in a bullish one.
Bearish abandoned child
The “dark covering cloud” is the reverse case of a “gap in the clouds”. This combination consists of two candles, and the first has a long white body, while the second has a long black one. At the same time, the black candle opens below the price of the white candle and closes above its middle. The stronger the second body “penetrates” into the first, the higher the chances that it is a strong signal about a trend reversal.
dark covering cloud
A strong top, “fortress” is a strong range, which for some time keeps quotes from growth. Then the candle opens with a gap down, and the trend changes to bearish.
A strong top, “fortress”
8-10 new peaks (the reverse situation is 8-10 new bottoms). With a growing trend, candlesticks are counted with new highs and profit is recorded when forming reversal patterns or candles. If the correction formed 8-10 new highs, then this is the signal to a possible reversal, if less, then the count is re-run.
8-10 new peaks
“Bear game, ending with a break”. This combination can be described as a frequent change in the mood in the market, which, in the end, ends up with a gap up and a reversal of the trend.
Bear game, ending with a break
Combinations confirming the continuation of the trend
In addition to reversal signals, candlestick patterns can give an idea of what moods are on the market today. And to correctly define them and have time to use them competently, you can rely on the following combinations.
“Three white soldiers” is one of the most understandable, “right” models, allowing to interpret the current situation on the market as having the potential for further growth. It is a set of three white candles, with the closing price of each next candle above the closing price of the previous one, and the opening price is within the white body of or near the previous candle. If this model appears in the area of low prices after a downtrend or consolidation period, this indicates a potential market strength capable of accelerating upward in the near future. Candles should preferably be of medium size, since heavily stretched bodies can talk about overbought markets.
Three white soldiers
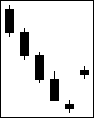
The reverse situation is formed in the combination “Three Crows“, which consists of three consecutive black candles, with the closing price of each next candle being lower than the closing price of the previous one, and the opening price is within the black body of the preceding candle or near it.
Three Crows
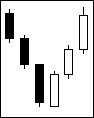
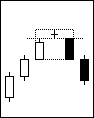
“The method of three drops” and “The method of three ascents” is a candle combination, where after a big candle, a short consolidation in a narrow range followed by a trend followed by a continuation of the main trend.
Let us consider in more detail the example of the method of three ascents. A candle with a long white body appears on the chart. Then follow three (maybe two or four) candles with small bodies, each of which does not go beyond the first white candle. Next is another candle with a large white body, the closure of which occurs well above the highs of the first white candle. After the second white candle, which is the final signal for the formation of the model, as a rule, further growth follows, which is the main goal for newcomers.
Mandatory condition – the closing price of the last candle should be higher than the maximum price of the first candle for the bull model, or below its minimum price for the bearish model.
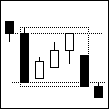 The method of three drops | 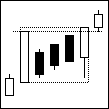 The method of three ascents |
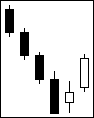
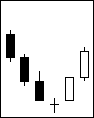
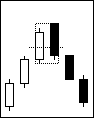
“Bear” and “Bull” gap “Tasuki.” The gap “Tasuki” – a model of the continuation of the trend, is a figure of three candles. The first two of them must be white in case of an uptrend (and set), and there must necessarily be a gap between the price of closing the first candle and the price of opening the second. The third candle of the model has the opposite color. It opens inside the body of the second candle and closes inside the gap or just below it.
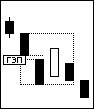 bear-Tasuki | 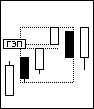 bull-Tasuki |
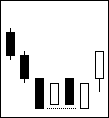
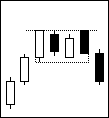
“Three simultaneous wings” is a candle pattern consisting of three candles, and the price of opening the second and third candles are equal to the closing prices of the previous ones.
Three simultaneous wings
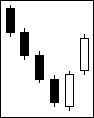
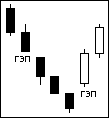
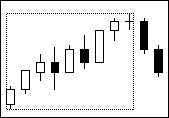
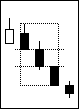
“Bull gap to the edge of white lines” is built on the basis of three candles of white color, while between the first and subsequent opens a gap, and the second and third candlestick in the size of the bodies are approximately equal. Further price increases should be expected in the event that the fourth candle closes above the level of the highest of the two candles.
Bull gap to the edge of white lines
Conclusion
In conclusion, once again, it should be recalled that any system should consist of a certain number of signals in order to achieve a high quality forecast (and filter false movements), and also contain a corresponding allocation of potential profit and risk.
Candle models, especially reversal patterns, need to be confirmed with additional signals. It can be graphic technical signals or at least just a fundamental assessment of the external background. An additional filter will significantly reduce the number of losing trades and allow in practice to understand what system trading is.
Candlestick combinations are a useful addition to technical analysis. Therefore, we hope that our memo will help you in the trade.