ADX indicator (Average Directional Index): How to use?
In this article, we will explain what ADX (Average Direction Index) is, how the ADX indicator is calculated, and how to use it to improve your trading efficiency!
What is ADX in trading?
The ADX indicator (average directional index) is a technical tool designed to measure the strength of a market trend. The ADX indicator is used for various purposes such as measuring the strength of a trend, finding a trend and a trading range, and as a filter for various Forex trading strategies.
Some of the best trading strategies are based on following the market trend. There are also strategies through which traders make profit by trading against the trend. In any case, if you can identify the emerging trend in time, your chances of making money increase noticeably.
Equally useful is the ability to determine the strength of a trend. ADX is one of those indicators that can help in this matter. The indicator was developed by J. Wells Wilder, who also created other extremely popular technical indicators such as:
- RSI indicator
- ATR indicator
- Parabolic SAR
Calculations of the ADX indicator
The ADX technical indicator is based on two Wilder directional indicators:
- Positive direction indicator (+DI)
- Negative direction indicator (-DI)
These indicators complement the ADX indicator by providing information about the direction of the trend . The indicators are based on fairly simple indicators of directional market movement: they compare the high and low of the current period with the high and low of the previous period.
Wilder identified two terms for them:
- Positive directional movement (+DM)
- Negative directional movement (-DM)
What does the Average Directional Index show?
Directional movement can be positive, negative or zero. It cannot be positive and negative at the same time, it can go either up or down. Therefore, when +DM is greater than zero, -DM is zero. And when -DM is below zero, +DM is zero.
Directional movement is positive when:
- current high - last high > current low - last low,
in this case, the result of subtracting the maxima is positive.
Directional movement is negative when:
- last low - current low > last high - current high,
the result of subtracting the minima is positive.
Accordingly, when +DMI is higher than -DMI, prices rise and ADX measures the strength of an uptrend. When -DMI is above +DMI, prices are falling. ADX measures the strength of a downtrend.
The good news for traders is that modern trading software automatically does these calculations for you. In this case, you do not need to download the ADX indicator separately: ADX is automatically included in the list of indicators on the MetaTrader 4 and 5 platforms.
ADX indicator: how to use
Once you install MetaTrader 5 on your device, you will see that the ADX technical indicator is much more complex than the one originally proposed by Wilder. This is due to the fact that MetaTrader uses slightly different methods of automatic smoothing, which are used to build a more accurate, but less smooth chart.
To add an average directional movement index to a chart:
- In the top menu bar, click Insert - Indicators - Trend
- Find the Average Directional Index in the dropdown list and click on it once.
- After that, a window will open where you can enter the period value, change the indicator colors and some other options.
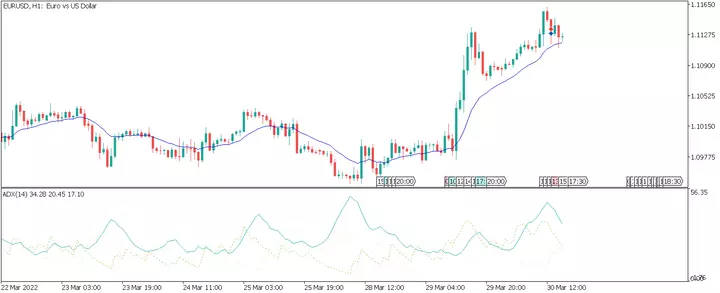
The default period value is 14 and the standard way to display ADX is to show three lines below the main price chart. These lines include a thick blue line for the ADX indicator itself, a light green dotted line for +DI, and a beige dotted line for -DI. Typically, the +DI and -DI values are displayed along with the ADX value.
How to read the ADX indicator?
As you understand, the ADX indicator is used to determine if the market is trending. But how do you know when a trend occurs? So, ADX ranges from 0 to 100. Wilder believed that a value above 25 indicates a trend in the market, while a value below 20 suggests that the trend is weak or not at all. For this reason, many modern technical analysts consider the value of 25 to be the key point between "trend" and "no trend" in the market .
Measuring the Strength of a Trend
The Mean Direction Index can also measure market sentiment by tracking changes within a price range. From the ADX line, we can measure the strength of the main trend. For example, according to Investopedia, if the ADX value is between:
- 0-25 - the trend is weak or absent
- 25-50 - the trend is strong
- 50-75 - the trend is very strong
- 75-100 is an incredibly strong trend
You can add these levels manually in the indicator properties.
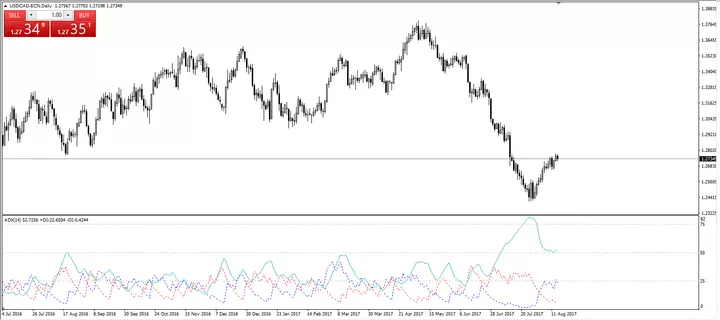
Determining the trend and ranges
As you can see, ADX signals when the trend has weakened and enters a period of consolidation. When ADX falls below the 25 level, it indicates the beginning of a sideways range. The chart also shows two dotted lines: blue (+DI) and red (-DI).
- if the +DI line is above the -DI line, the market is in a bullish trend .
- if the -DI line is above the +DI line, it is a bearish trend .
The strength of the trend is indicated by the ADX line.
Here's how Wilder suggests interpreting this indicator: when the ADX line starts to rise, it indicates a strengthening trend , so traders should trade in the direction of whichever DI line is higher. If +DI (blue line) is above -DI (red line), it means that the bullish trend prevails, and vice versa. Thus, with ADX, you can measure both the strength of a trend and its direction.
In the chart below, you can see a strong bullish intraday trend:
ADX indicator: trading strategies
The ADX indicator can also be used in various trading strategies. We will consider an example of one of these strategies. The strategy also uses the MACD indicator.
Timeframe: Daily
Pairs: EURUSD, GBPUSD, AUDUSD, USDCHF, GBPJPY, EURJPY, NZDUSD, USDCAD
Indicators: MACD (3,10,18), ADX (18 with blue +DI and red -DI), Admiral Pivot (Monthly - MN1)
Opening a buy position :
- MACD crosses the 0 line up
- The blue line (+DI) is above the red line (-DI)
If the light green ADX line is above 25, then the trend is strong (it may continue)
Opening a sell position :
- MACD crosses the 0 line down
- The blue line (+DI) is below the red line (-DI)
If the light green ADX line is above 25, then the trend is strong (it may continue)
Target levels (position closing levels) are determined by trailing stops. Stop loss should be placed at such a distance that the maximum risk per trade is 2% or any other level that you deem appropriate.
Conclusion
Like many trend indicators that analyze historical data, the ADX is a lagging indicator that will not indicate a trend until it is definitely in the market. The ADX indicator is included in the MetaTrader 4 and 5 package by default, so it does not need to be downloaded separately.