AIG Daily Chart – 19 Dec 2010
Technical chart of AIG and its movement using Doda-Donchian and Kumo.
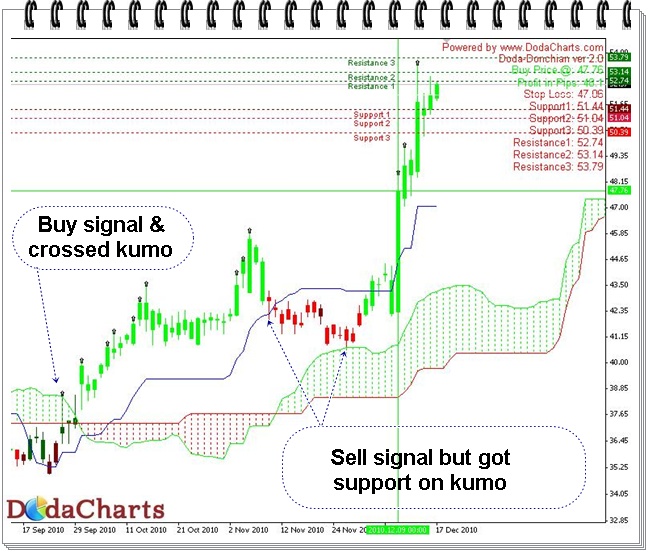
Around 21st Sep 2010, Doda-Donchian gave Buy signal for AIG. It faces resistance on kumo after that, but it crossed it without any problem as the thickness of kumo was very thin. It went upto the high of $45.93, after which it started its down movement.
Then on 10th Nov 2010, it gave Sell correction on Doda-Donchian @42.47 but it got support on Kumo viz. $40.70, and it re-started it upward journey. Another Buy signal from Doda-Donchian and its last close was $52.57.
I illustrated this example to show how easy it becomes trading when we combine the power of Doda-Donchain and Ichimoku. Kumo of Ichimoku can be best use to get important support & resistance levels.. I'll code Kumo in my next version of Doda-Donchain.
Now, what next. Although, the price is rising, but Doda-Donchain line is flat. If it continues to remain flat, it will attract price. That means we can see its price around $47 in coming days. However, if Doda-Donchain line also starts moving upwards, one can continue to be bullish on this stock.