AUDJPY Technical Chart Explained | 25-Oct-2017
Below is the technical chart of AUDJPY explained with different technical indicators.
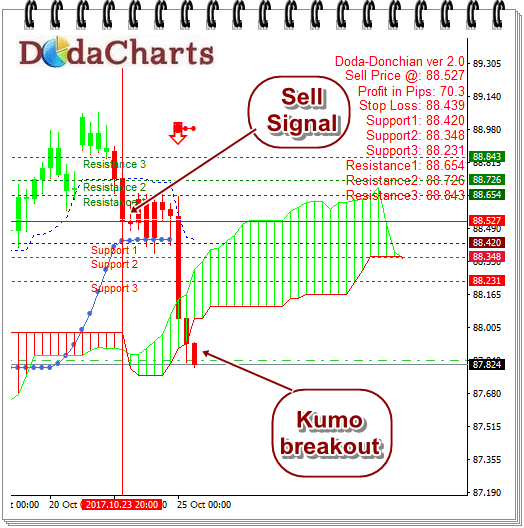
AUDJPY Technical Chart
I’ve used Doda Donchian, Doda-Bollinger Bands, Ichimokuand ADX Candles in this chart. Time frame used is H4.
 AUDJPY Technical Chart
Doda Donchian gave sell signal @88.527 but it moved sideways after that as the currency pair was trading above Doda Bollinger bands. Once it closes below Doda Bollinger bands, it became further weak but then it was trading inside kumo of Ichimoku indicator. Kumo is always NO trade zone.
But now, things have changed. AUDGPY managed to cross kumo also. Future kumo is also bearish.
MACD, Aroon and Doda Stochastic indicators also confirmed that.
So, one can take short sell call here. Currently, it is trading @87.866 with a stop loss of 88.10
Major Support Levels are:
88.420
88.348
88.231
Major Resistance Levels are:
88.654
88.726
88.843