AUDUSD Technical chart | 15-Dec-2011
Below is the technical chart of AUDUSD currency pair, with Doda-Donchian and Doda-Bollinger Bands indicator.
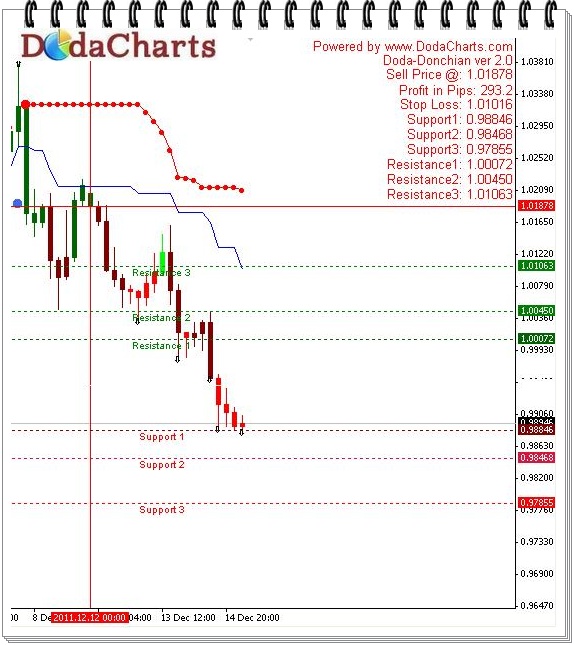
After getting the sell signals from both the indicators, it started its downward journey. At the time of writing this post, it has already given a profit of 293 pips (and counting). Now, it will get support at 0.9775, which is its monthly support level. I suggest to book your profits at that stage and sit on cash.