Average True Range
The Average True Range (Average True Range) developed by J. Welles Wilder, the first time presenting it in a book – “New Concepts in Technical Trading Systems” (1978).
Initially, like most other indicators, it was created for commodity markets (which are more volatile than stocks) and end-of-day prices, but are now used for Forex as well as for other periods. The Average True Range is an indicator of volatility.
Formula for Average True Range
ATR = Moving Average (TRj, n),
where
TRj = the maximum of the moduli of the three values
| High – Low |, | High – Closej-1 |, | Low – Closej-1 |.
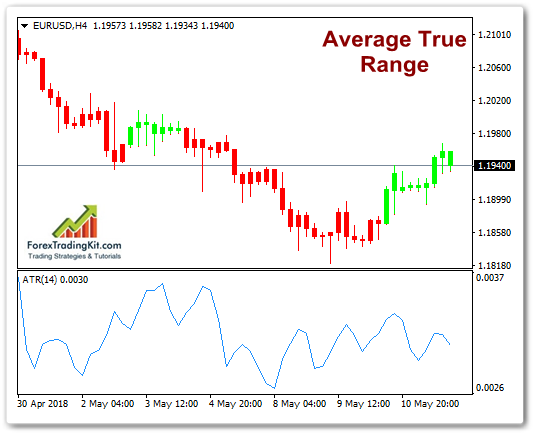
Sample chart with Average True Range:
Description of Average True Range
Initially, Wilder determines the True Range (TR), which is defined as the maximum of three values.
- The difference between the current high and the current minimum;
- the absolute value of the difference between the current high and the previous close;
- the absolute value of the difference between the current minimum and the previous close.
If the range of oscillations within the period (the difference between the maximum and minimum) is sufficiently large, then most likely the value of TR will be calculated from it. If the difference between the maximum and minimum is sufficiently small, then the other two methods mentioned above will most likely be used to calculate the TR. The last two options are usually obtained if the previous close is greater than the current high or the previous close is lower than the current low. Recent situations – price gaps or gaps (gaps) are quite rare in Forex and mostly happen on weekends if the serious news has been released during the weekend.
The average True Range (ATR) is derived from the TR by averaging over any of the methods-a simple averages, exponential, or other.
How to use Average True Range?
Usually use a 14-period ATR, which can be calculated for intraday as well as daily or weekly or even monthly data.
Extreme values of the indicator often indicate the turning points and the beginning of a new movement. Like other indicators showing volatility, such as the Bollinger Bands, the Average True Range cannot predict the direction or duration of the movement, it only indicates the level of activity.
Low level indicator Sredniy true range (Average True Range) represents a quiet trade in a small range, and higher values denote intensive trade in a wide range. A long period of low ATR means consolidation, which is likely to lead to a rapid continuation of the movement or reversal. High ATR values are usually the result of rapid movements and rarely remain for a long period. Since ATR shows the absolute value of volatility, the currency pairs in the Forex with low prices will have a lower ATR and, vice versa, other things being equal.
The main concept of the indicator is the average true range (Average True Range) can be expressed as follows: the greater the value of the indicator, the greater the probability of a trend reversal; The smaller the indicator value, the weaker the trend orientation.
Disadvantages of Average True Range
As a disadvantage, usually one is indicated – for a long period ATR may be late, indicating not current and past volatility.