Axis Bank Technical Chart | 03-Dec-2011
 Below is the technical chart of Axis Bank, listed on Indian stock exchange, with
ichimoku indicator.
Below is the technical chart of Axis Bank, listed on Indian stock exchange, with
ichimoku indicator.
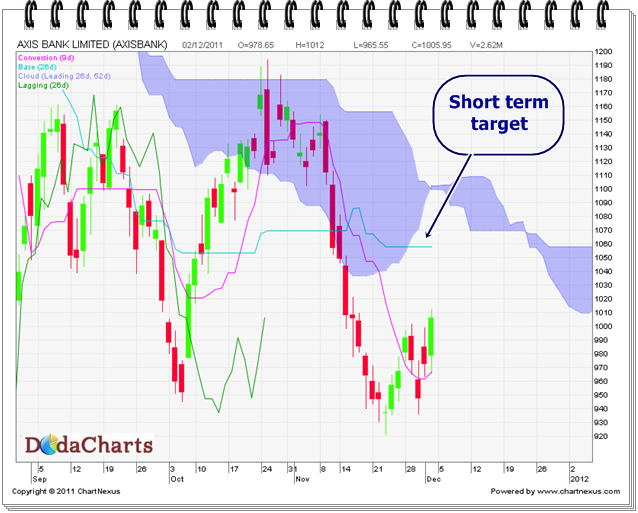
In the month of Nov. 2011, Axis bank stock fell sharply like other banking stocks of India.
If you observe the chart carefully, while the price of the stock was falling, the kijun-sen line was flat. As a result, the price now started upward.
So, in the result, the price can touch the level of 1057.80. One must book profits at that level as that is a strong resistance on daily chart as well as on weekly chart.