Beginners Guide to Moving Average
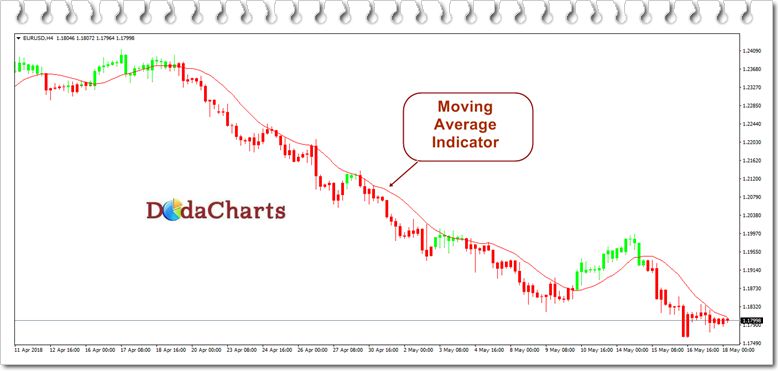
Moving average ( MA – moving average ) is a technical indicator based on an analysis of the behavior of securities quotations and their moving average. The moving average is one of the oldest and most common indicators of technical analysis related to trend indicators.
The moving average is a low-pass filter, that is, it passes low-frequency activity (long-term cycles and their trend lines), cutting off high-frequency – random oscillations.
To use the indicator at the same time, the price charts and its moving average are combined.
The type of moving average and the construction period (the number of time periods over which averaging is performed, sometimes called the order or time window or length ) is selected by the trader at his discretion and depends on the trading horizon, the market volatility and the instrument. And, at different intervals of time different types of moving averages and different construction periods can be used. The choice of these parameters is considered so complex that it has become a separate branch of technical analysis. However, in the general case it is recognized that the longer the forecast time, the greater the order it is necessary to choose for the moving average, and vice versa.
For the construction and analysis, usually use any of the generally accepted stock prices (opening, closing, maximum, minimum, average, weighted average), but usually, use the closing price.
Moving Average Strategies
The most popular strategy is that the instrument is bought, provided that the price chart crosses its moving average from the bottom up, and is sold when the price chart crosses the moving average chart from top to bottom. Both phenomena are called breakdown.
In addition, it is believed that if the price chart line is above the moving average, then the market is considered “bullish“, on which you can buy, and if on the contrary – “bearish“, preferred for sale.
Moving Average Signals
Usually, the indicator gives a lot of false signals to buy or sell. To minimize this phenomenon, several methods are used:
- The decision to buy / sell is taken if between the price chart and the moving average after its breakdown a distance equal to a certain number of minimum price changes for the instrument is established.
- The decision to buy / sell is accepted if, after the breakdown of the moving average, some fixed time has passed, but the trend has not changed.
- By the method of interest envelope. Instead of a moving average, two lines are built: one above, and the other below, separated by a certain percentage from the calculated moving average. The decision to buy is taken after the price chart crosses the upper line from the bottom to the top and vice versa, the decision to sell is taken after crossing the price of the lower line from top to bottom.
- By the strip method. Instead of the moving average, built at the closing price, two moving averages are constructed at the maximum and minimum price. Decisions are made when crossing these lines with a price chart similar to the method of percentage envelope method.
In 1992, Tushar Chande (Tushar Chande) developed an adaptive model of the moving average, in which the construction period depends on the volatility of the price – VIDYA . In 1995, Perry J. Kaufman (Perry J. Kaufman) offered his version of such a technical indicator – Adaptive Moving Average Kaufmann.
In general, the moving average graph is correlated with the last price, but some traders shift it a few gaps forward or backward.
Advantages of the moving average
- Any change in the trend is preceded by a break in the curve of the moving average of a certain type, calculated for a certain period.
- Full automation of decision making.
- The most effective tool with pronounced trends.
- Easy to use and easy to understand.
- Multifunctionality.
Disadvantages of moving average
- Signal lag.
- A significant number of false signals, especially with a sideways trend.
You also need to know that moving averages can be applied not only to a number of prices, but also to arbitrary series, for example, to other indicators, interpreting the result in the way described above.