BHEL Technical Chart | 21-Nov-2011
Below is the technical chart of BHEL, listed on Indian stock exchange, with Ichimoku Kinko Hyo indicator.
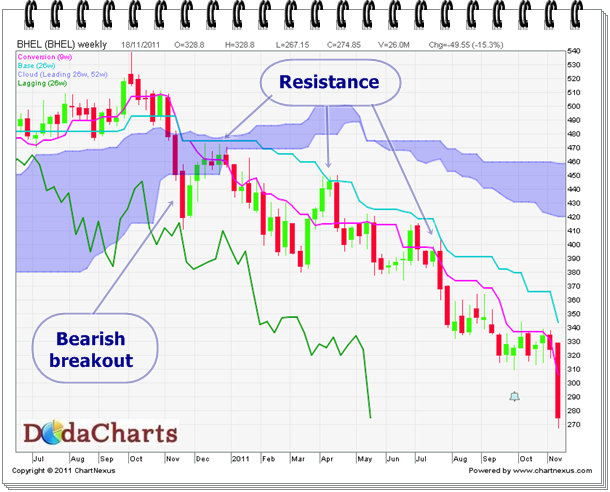
On week ending 26-Nov-2010, BHEL CLOSED below kumo at 419.37, giving bearish breakout. That was the first signal of its weakness and opportunity to do short selling in BHEL. After that it tried many time to cross kijun-sen line, but every time it failed. In the last trading session, it closed at 274.85. Still, it is below kijun-sen line and kumo. So, it is not the right time of investments here. Buy ONLY when it closes above kijun-sen line viz. currently at 345.