Bollinger Bands - Using right way
I started trading with Bollinger Bands and still use it. This very popular indicator is very simple to understand and particularly effective . It is present in most books and training on trading. I still use it in swing trading. I consider it an indispensable tool that should be part of a trader's arsenal of techniques. In this article, I will explain to you how to use Bollinger bands.
What are Bollinger Bands?
Bollinger Bands is a technical indicator created by John Bollinger. It is used to know if a market is volatile. It is composed of a 20-period moving average (represented by the lines on the image) from which a high and low band is drawn at a standard deviation of 2 (the pink lines at the top and bottom on the 'image). The settings of 20 periods and standard deviation of 2 are the basic settings of this indicator. If the price moves according to the normal law, 95% of the candles must be in the interval between the line above and that below. Finished for the theory, concretely, what is it for?
The quieter a market is, the closer the bands will be. Conversely, very wide lines indicate that the market is very volatile. We therefore have information on market volatility at a glance.
The phases
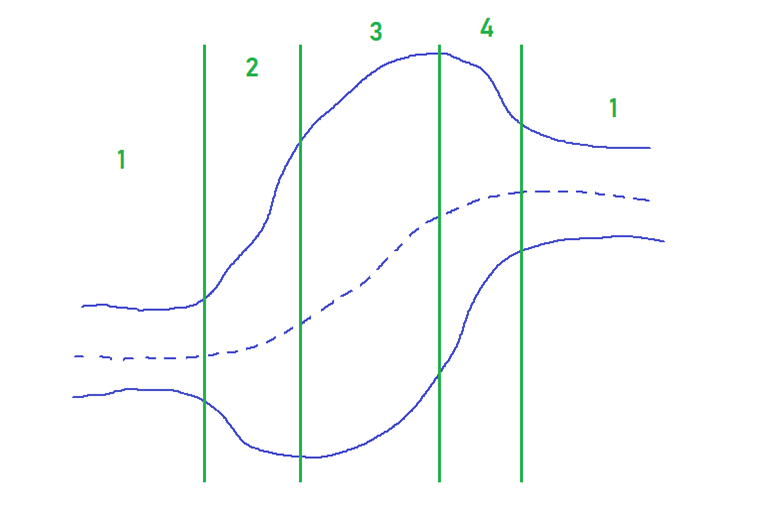
Phase 1 : The Bollinger bands are brought together. There is no trend and the price is not very volatile. The longer this phase is, the more likely it is that phase 2 will be powerful.
Phase 2 : The bands move apart. This indicates an increase in volatility which will be followed by phase 3.
Phase 3 : Appearance of the trend. The upper band and the lower band now point in the same direction and indicate that a trend is in progress, until the appearance of phase 4.
Phase 4 : The upper and lower bands come together. There is a divergence which indicates that the trend is running out of steam. This phase will be followed by phase 1.
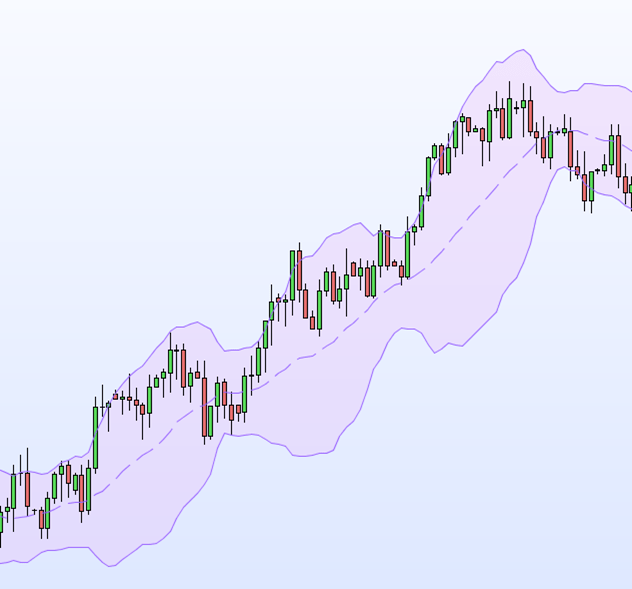
Bollinger phases are not always easy to spot, but when they are clearly visible, it is a pleasure to trade! Below, an example where I leave you the pleasure of identifying the phases.
How to Trade with Bollinger Bands
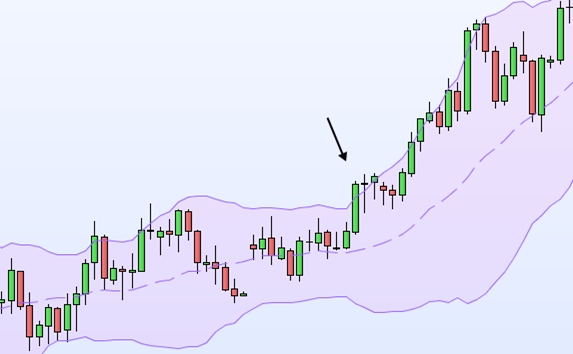
1. The end of a calm
This first method is the application of the phases seen previously. After you have spotted a period with very little volatility, corresponding to phase 1, you will enter a position to buy at the breakout of the upper Bollinger band (or to sell at the breakout of the lower band) . You will then leave the position open, until the appearance of phase 4 where you will recover your gains.
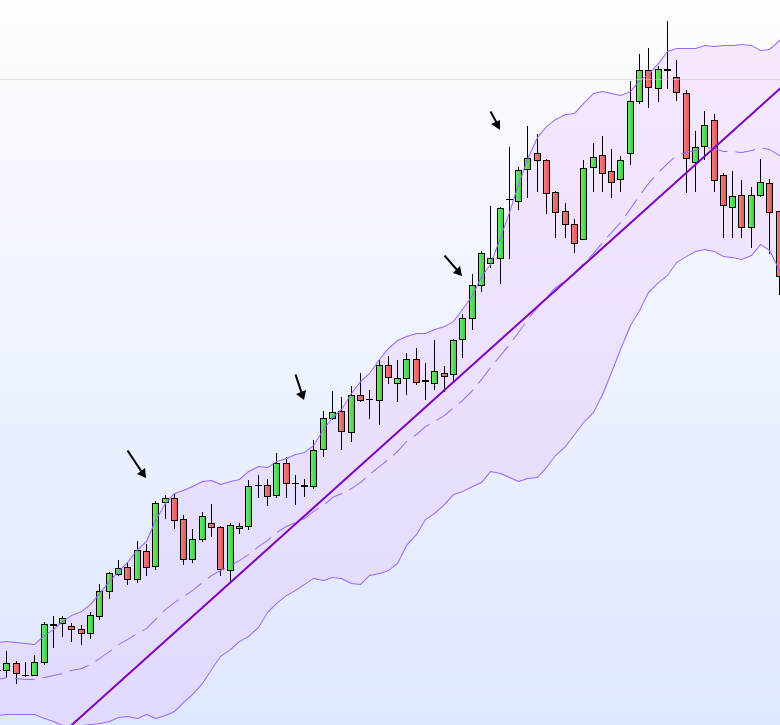
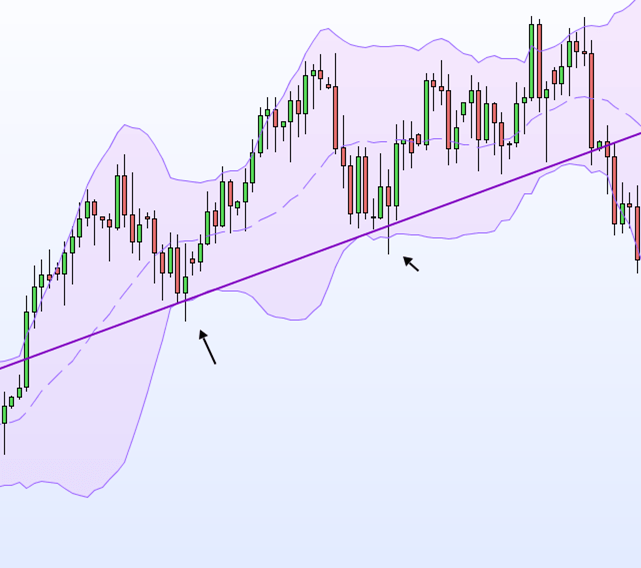
2. Trend following
The indicator gives excellent entry signals when paired with a trend line. The least risky method is following a strong trend. In this case, we will simply open a position when the upper and lower lines break. In other cases, we can open a position on the rebounds on the high and low lines to anticipate the continuation of the trend. As for the previous method, the closing of the position will take place at the start of phase 4. Here are two examples.
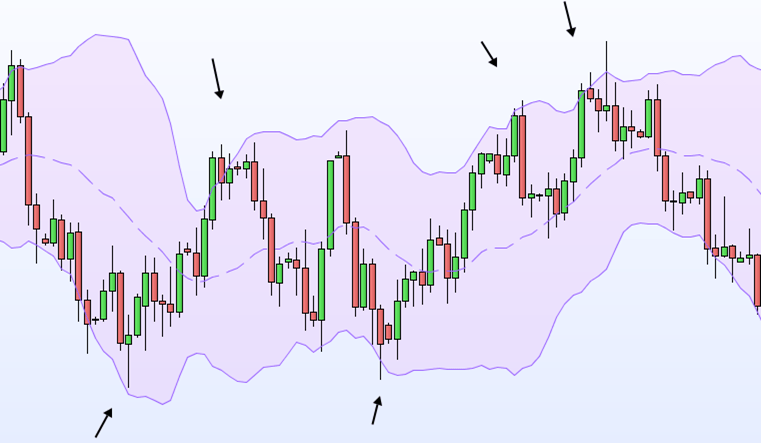
3. Trade when there is no trend
A final method is to use Bollinger Bands when the market is trendless. Because even in this situation, it is possible to use this super indicator. Indeed the high and low extremes give an excellent level of support/resistance . When the market is in range, we can therefore trade the rebounds between the 2 lines. It will therefore suffice to open a position when in contact with one of the lines and to close it when the market comes into contact with the opposite line.
What you must remember
Bollinger bands are an excellent indicator, very versatile. It is easy to understand and gives very clear signals. It is perfectly suited for beginners and remains super useful for experts. Combined with other indicators such as the RSI , the MACD, etc., it will allow you to be profitable if you have carefully analyzed your market beforehand.
Tips to use Bollinger Bands
John A. Bollinger identified the following characteristics of his indicator:
- Prices tend to move sharply after the bands narrow.
- If the price breaks out of one of the bands, it is assumed that the trend will persist
- If prices make highs or lows outside the bands and then make highs or lows inside the bands, this may suggest a trend reversal.
- A movement (a trend) that begins on one band always tends to extend to the opposite band. This makes it possible to make price projections.
Advantages of Bollinger bands
- Bollinger Bands can be a good trend indicator. This is because strong trends create volatility, which is easy to observe when the Bollinger bands move apart and tighten.
- When added automatically by a trading platform, Bollinger Bands are very easy to use and can add an extra dimension to a trader's chart analysis.
Disadvantages of Bollinger Bands
- As a lagging indicator, Bollinger Bands cannot predict price trends. Instead, they follow current price changes. This means that traders only receive signals when the price change has already started.
- It should also be noted that John Bollinger - the inventor of Bollinger Bands - said that they should be used alongside other forms of technical analysis and are not infallible trend indicators.