Book Profits in Nifty | Technical chart | 16-Feb-2012
Below is the technical chart of Nifty, on weekly time frame, using some technical indicators. But we’ll focus main on Ichimoku kinko hyo indicator.
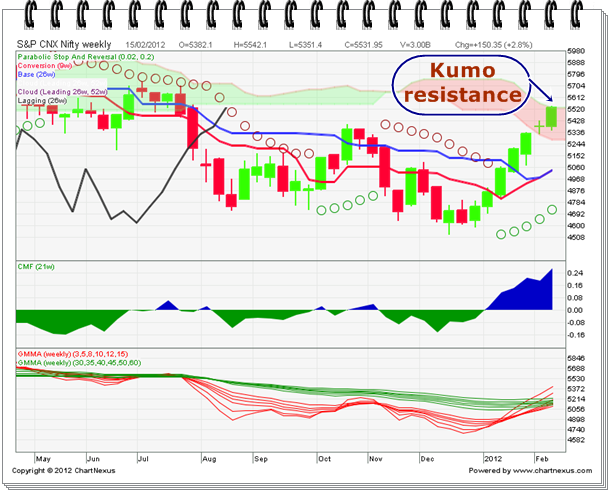
On weekly time frame chart, Nifty has touched the upper line of Kumo, which was high resistance zone. It can not cross such a resistance zone without any correction. So, I suggest to book your profits at this stage and sit on cash. On the downside, its support is at 5330 and then at 5287. Enter at these levels again.