Book Profits in Yes Bank | Technical Chart | 01-May-2012
Below is the technical chart of Yes Bank, listed on Indian stock exchange, using Ichimoku kinko Hyo indicator.
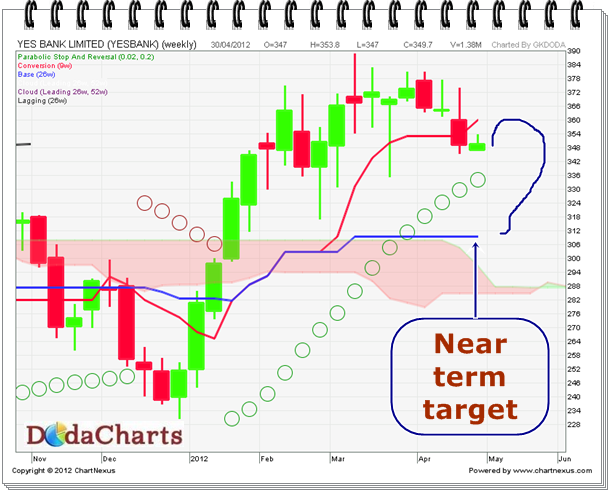 Yes bank technical chart clealry shows to book profit in it. The price is rising in weekly chart but kijun-sen line is flat. The expected price movement of this share has been drawn in the above chart. Near term target is Rs.309. Even on daily chart, the price has entered inside kumo i.e. no-trade zone.