Bullish Kumo Breakout on IBM Technical Chart | NYSE | 29-June-2011
![]() Here is a chart of International Business Machine (IBM) listed on New York Stock Exchange (NYSE). I’m using Ichimoku indicator to look inside the chart.
Here is a chart of International Business Machine (IBM) listed on New York Stock Exchange (NYSE). I’m using Ichimoku indicator to look inside the chart.
This is the technical chart for the last 3 months.
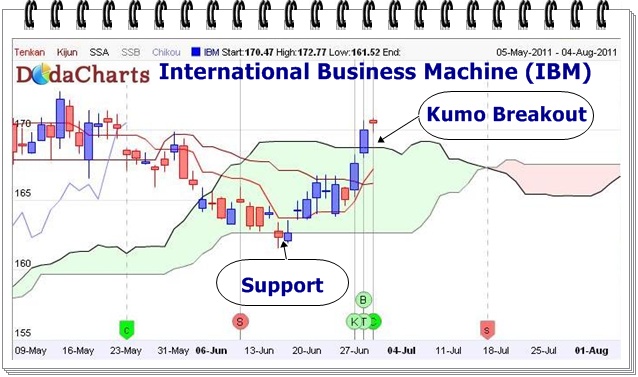
As you can see, the price took support around mid of June on kumo and managed to go upward. In the last trading session, not only the price closes above kumo but also Chikou Span (CS) managed to close above kumo; thus giving bullish kumo breakout @$170.54. One can now take buy call on this stock with a stop loss of kumo. The immediate next resistance is @173.54
And this is the technical chart of IBM using ichimoku indicator for the last 6 months.
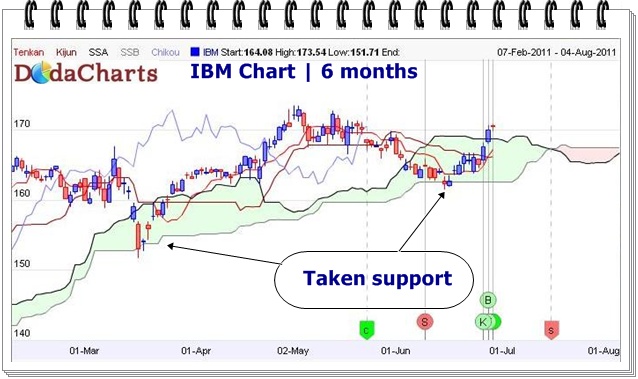
As mentioned on the above chart, the price took support on kumo twice on around mid of March and mid of June this year. That shows how important the levels of kumo for support and resistance.