Bursa Malaysia Kuala Lumpur Composite Index Technical Chart Bullish
This is one of the perfect example of Kumo breakout. The FTSE Bursa Malaysia Kuala Lampur Composite Index is in bullish mode since July 2010. Let's study the technical chart with Ichimoku indicator.
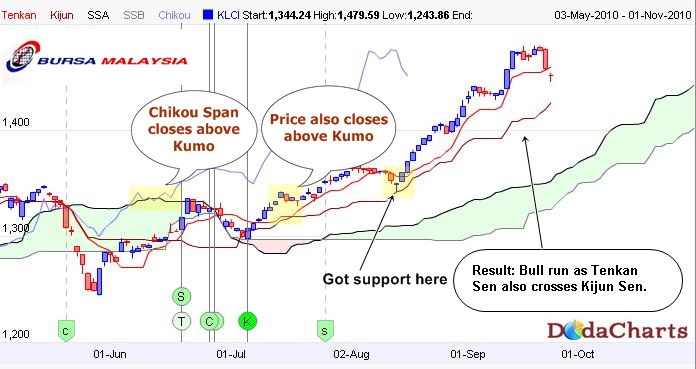
On 18th June 2010, Tenkan Sen crosses Kijun Sen below Kumo. Since the cross was "Below" kumo, it was a weak bullish signal. Result: Price faces resistance & can not cross kumo.
On 28th June 2010, it gave Kumo breakout as prices manages to close above kumo at 1325.54 but Chikou Span (CS) was below Kumo. In fact, price came below Kijun Sen but finds support on Kumo.
On 6th July 2010, price managed to close above Kijun Sen & around 14th July Chikou Span(CS) also managed to close above Kumo. That was the golden chance.
Whenever, price & CS closes above kumo, just buy that stock & put a stop loss of Kumo.
Result: Strong bull run & it reached the high of 1479 also.
Book your profit when price will close below kijun sen & take short position when price & CS closes below Kumo.