Buy SBI | Technical Chart | 14-June-2012
Below is the technical chart of State Bank of India, SBI, listed on Indian stock exchange, using ichimoku kinko hyo indicator.
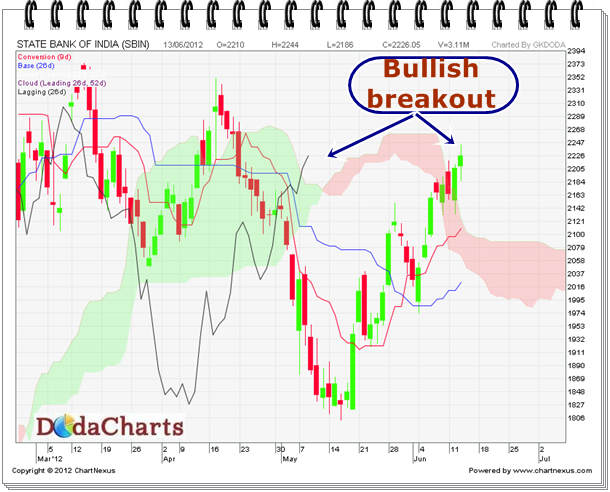
In the last trading session, price of SBI managed to close above kumo, which was its main resistance. Chikou-Span (CS) line has already closed above kumo. That clearly gave bullish breakout. But it with a stop loss of 2096
On the weekly chart, however, it will face resistance at Rs.2267. The major support is @Rs.2051.