Buy Terex Cp (TEX) | NYSE | Technical chart | 19-Apr-2012
![]() Below is the technical chart of Terex Cp, listed on NYSE, using Ichimoku indicator.
Below is the technical chart of Terex Cp, listed on NYSE, using Ichimoku indicator.
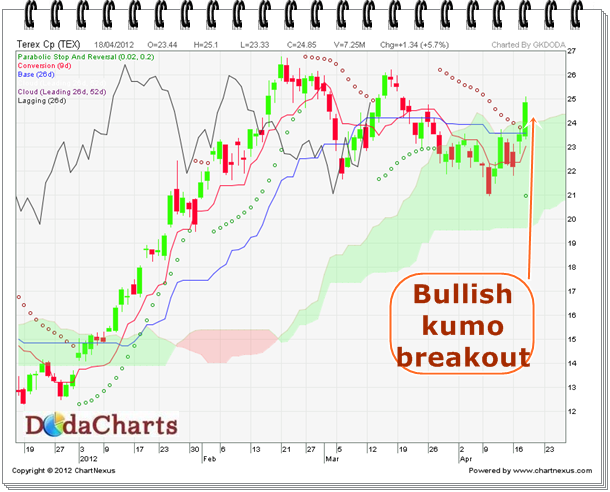
In the last trading session, the stock price closed above kumo once again. The Chikou-Span (CS) line is already trading above kijun-sen line and kumo. Thus, one can safely say, it’s a bullish breakout signal @24.85. The resistance will be at 26.35 – 27 and major support is at 19.52