Cairn India Technical Chart | 05-Dec-2011
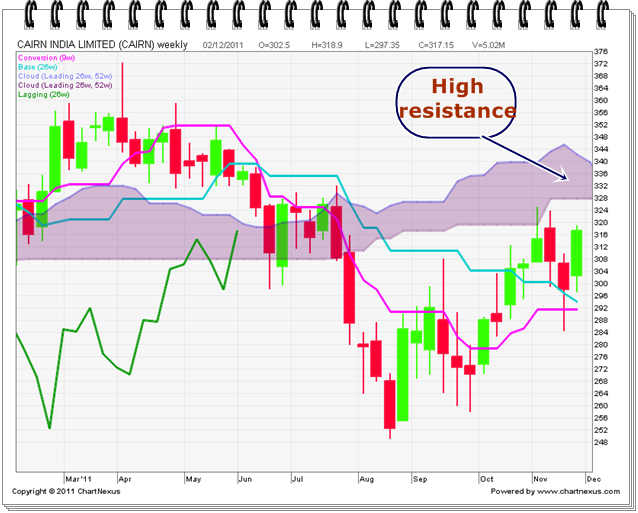
Below is the technical chart of Cairn India, listed on Indian stock exchnage, with ichimoku Kinko Hyo indicator. I’ve used weekly time frame here.
On a daily chart, Cairn India is in bullish mode. Price, Chikou-Span are above kumo. No problem.
But on weekly chart, price is still trading below kumo. Chikou-Span is still below kumo. The only positive sign is that price has crossed kijun-sen line.
Now, the price will face touch resistance on kumo, which is in the range of 327.50 to 339.50. Once the price CLOSES above this level, take long position here. You’ll see its bull run in very speedy manner for a target of 372.