Cipla Technical Chart | 07-Dec-2011
Here is a technical chart of Cipla, listed on Indian stock exchange, with Ichimoku indicator.
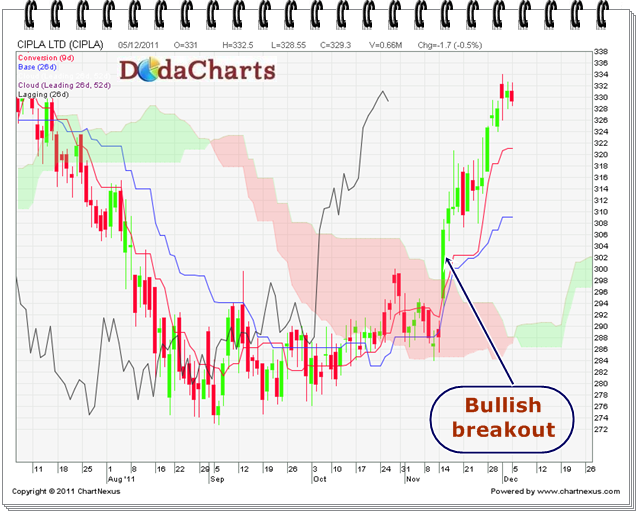
On 15-Nov-2011, Cipla gave bullish breakout @306.85 as it closed above kumo. It touched the high of 334.05 on 01-Dec-2011.
But after that Kijun-sen line has become flat. Otherwise also, 333-335 is a tough resistance zone for Cipla.
So, if you’ve taken long position in Cipla, it’s better to book your profits now and sit on cash. Take long position only when it CLOSES above 335 on weekly base.