Commodity Channel Index (CCI) Technical Indicator
Introduction to Commodity Channel Index
The Commodity Channel Index ( CCI) was developed by Donald Lambert. Initially, the Commodity Channel Index was created as an indicator for determining the turning points on commodity markets, but over time it became popular in the stock market and in the Forex market. The assumption on which the indicator is based is that all assets move under the influence of certain cycles, and the maxima and minima appear with a certain interval.
CCI refers to the type of oscillators that measure the speed of the price movement.
Formula of the Commodity Channel Index indicator:
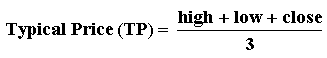
First, a typical price (Typical Price) is calculated:
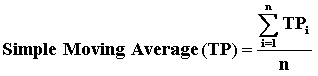
A simple moving average is calculated from the characteristic price:
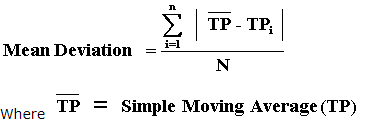
The probable (median) deviation is calculated.
The formula for the CCI indicator itself will look like this:

For scaling purposes, Lambreth set the constant at 0.015 so that approximately 70 to 80% of the Commodity Channel Index values were between -100 and +100.
Description of the Commodity Channel Index indicator
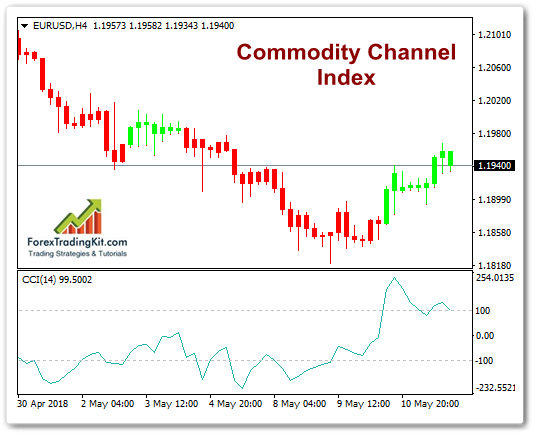
The CCI indicator oscillates above and below the zero mark. The percentage of Commodity Channel Index values that are between +100 and -100 will depend on the number of periods used to build it. The shorter (with fewer periods) CCI indicator will be more volatile, and less than its values ??will fall in the range between +100 and -100. Accordingly, the more periods will be used to calculate the CCI, the more percentages of the indicator values ??will be between +100 and -100.
The author himself recommended as the main parameter of the CCI indicator 1/3 of the full cycle (for example, from a minimum, to the next minimum or from a maximum to the next maximum).
For example. If the cycle of market fluctuations is 30 days, the recommended value for the CCI indicator is 10 days.
Note: the very definition of the cycle length must be made independently of the Commodity Channel Index and other methods.
CCI is a sufficiently versatile indicator, capable of creating a wide range of signals for buying and selling. Traders and investors use the CCI to determine the reversal price points, extremes on the price chart and the strength of the trend. Like most CCI indicators, it should be used with confirmations from other techniques.
How to use Commodity Channel Index Indicator?
The author’s recommendations for work The commodity channel index concerned movements that go above +100 and below -100 and give signals for buying and selling. Since 70 to 80% of the time CCI values are between the levels of +100 and -100, signals for buying and selling will appear 20 – 30% of the time.
- When the CCI indicator crosses +100 from the bottom up, it is considered that the currency pair enters a strong uptrend, and a buy signal is given. The position closes on the reverse signal, when the CCI falls below +100. When the CCI crosses -100 from top to bottom, it is considered that the currency pair is moving into a strong downtrend and a sell signal is being sent. The position closes when the CCI back crosses its level -100.
- In addition to the author’s recommendations, the CCI indicator was subsequently used to determine the turning points. CCI can be used to determine overbought and oversold levels of the market. It is believed that the currency pair is oversold if the CCI drops below -100 and is overbought if it grows above +100. After the CCI indicator entered the oversold zone (below -100), a buy signal occurs when the -100 level crosses in the opposite direction (bottom-up). When CCI is in overbought zone(above +100) a sell signal occurs if the CCI crosses the +100 level in the opposite direction (from top to bottom).
- Like most oscillators, the CCI uses divergence analysis, which amplifies the trading signal. A positive divergence below -100 (ie, two consecutive minimums for the CCI, when the second minimum is higher than the first on the indicator, but below the first in the price chart ) increases the signal strength when crossing at a -100 level from the bottom up. Negative divergence above +100 (ie, two consecutive highs above +100, when the second maximum is lower than the first on the indicator, but higher in the price chart) increase the signal strength of the + 100 level applied at the CCI crossing from top to bottom.
- The breaking of trend lines formed on the indicator itself can also be regarded as input or output signals from a position. Trend lines can be drawn by connecting successive highs or lows. At the oversold level (below -100), breaking such a trend line up is considered a signal to the market growth and vice versa at overbought levels (above +100), breaking down the trend line down can be regarded as a sell signal.
Disadvantages of Commodity Channel Index
The Commodity Channel Index is designed for cyclical markets and works well only when the market is really exposed to fairly constant cycles. In the Forex market cycles are difficult to recognize, so the optimal period of the CCI indicator is selected with great ddifficulty.