Complete Guide to Japanese Candlestick Charts
Japanese Candlestick Charts can be called 8th wonder of this world. One can easily and quickly forecast the future of any forex currency pair movement or stock market or commodity market movement just by looking at the chart. Of course, other technical indicators like MACD, ADX, RSI, Stochastic, Doda Donchian will make your work more easily and accurately.
You must learn Japanese Candlestick Charts thoroughly if you really want to make money in this market.
History of Japanese Candlestick Charts
Candlestick analysis appeared in the XVII century, long before the classical, Western technical analysis, which was developed by Charles Doe at the beginning of the XX century.
The very first futures exchange in the world was the rice market in Osaka, Japan and was called Dozhimy. It was here that the well-known Monehisa Homma traded, the trading principles of which were used as a basis for candle analysis by his followers. They are often called “Japanese candles” because the Japanese used them to analyze the prices of rice supplies.
Legends and proverbs made up the wealth of this man. There is evidence that Homma conducted 100 successful deals in a row. He could afford a “living phone” from people standing on the roofs of houses from Sakata (the homeland of Homma) to Osaka and passing on the chain fresh quotes from the rice exchange.
What are Japanese candles?
Japanese candles are a method of presenting price charts, along with lines and bars. But according to many traders, the candlestick chart best reflects the supply and demand for traded paper and, consequently, the price dynamics. It was noted that Japanese candles or their groups often point to turning points on the charts. Richard Smitten put forward in one book his assumption that the great speculator Jesse Livermore used in his trading strategies such rotary models. In this tutorial section, we will look at all the most important aspects of candlestick analysis, as well as popular candle patterns that will help you better understand Japanese candles.
How are Japanese candles built?
The candle chart consists of a series of candles, each candle represents one period of time. Like bar charts, candlestick charts also display prices for a certain period of time: opening, maximum, minimum and closing. The difference is the use of colour in order to show whether prices have been rising or falling during the period.
You can use Japanese candles on any timeframe: from minute to week. Everywhere the same information is displayed:
- Price of candle opening
- Closing price
- Maximum of the candle
- Minimum
The levels of opening and closing frame the body of the candle, and the distance from the body to the maximum and minimum of the candle matches the wicks or shadows.
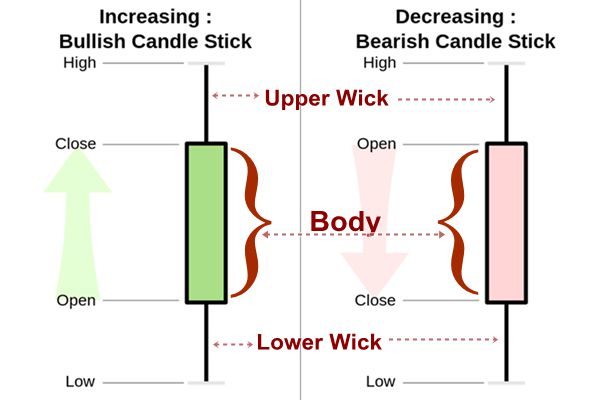
When the price is rising it is represented by a white candlestick (or Green)
When the price falls, it is represented by black candlestick (or Red).
In terms of concrete name, white candlestick is called “positive line”, black candlestick is called “hidden line”.
Basics of analyzing Japanese candles
- A large hollow body – speaks about the preferential pressure of buyers and often occurs at the beginning and end of an upward price fluctuation.
- A large black body is the opposite of the previous one.
- The long lower shadow is usually, but this is not the law, it arises at the bottom of the downward movement, and indicates the pressure of buyers, and the possible reversal of the trend. That is, the sellers continued to push the price down, but at some point, the buyers stepped up and managed to close the candle (the time interval) closer to the maximum.
- The long upper shadow is opposite to the previous one.
Such a simple and graphical analysis of the chart will not give you any other tool: whether it’s a bar or even a line. Japanese candles are the best method for determining the preferential mood of stock exchange players, as well as its changes. And this is the whole essence of trading.
Candlestick’s foot basic
Candlesticks are drawn using 4 values ??(opening price, high price, low price, closing price), draw positive lines (white candles) if the closing price is higher than the opening price, and if the opening price is lower than the closing price, (Black candle) will be drawn. Also, if the opening and closing price are the same or nearly the same, draw a calling attention line (cross shape). There is “beard” at the top and bottom of the candle, indicating high and low, respectively. In other words, if you are forming positive lines, the stock price has risen, and conversely, if you are forming hidden lines it can be said that stock prices have declined. The calling line shows the turning point.
Candlestick Type
Positive line
Hidden line
Close calling line
2 types of Candlestick patterns
Broadly classified, there are 2 types of Candlestick patterns:
- One is the pattern which is made by SINGLE candle. It is also called SIMPLE Candlestick Pattern.
- Second is the pattern, which is formed by 2 or more candles. They are also called COMPLEX Candlestick Pattern.