Creating graphs of tic-tac-toe point-and-figure charts
Graphs Tic-tac-toe are a special type of graphical analysis, which emphasizes the forecasting of medium and long-term trends.
Creating graphs of Tic-Tac-Toe (Point and Figure) :
Most of the most popular charts used in the technical analysis are built at opening, closing, high and low prices for a certain period. In the construction of the Krestikov-tozikov charts, only the closing price of the period is involved.
Charts Tic-Tac-Toe consists of columns X and O, who take filtered reflect the price change. Price growth is shown by X cells, and prices drop by O cells. New cells are drawn only if the price has changed by the cell size or more in one direction.
Thus, each graph has a setting, called the size of the “cell” – a conventional unit of the size of the price movement, which is displayed on the graph. The size of the “cell” is the number of points at which the price should pass above the current cell X (or below the current cell O) so that a new cell X (or O) is added.
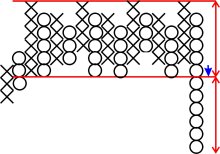
For example, if the price has increased by three established cell sizes, then on the graph this will be displayed as three X cells.
![]()
three X cells
If the price movement unfolds, a new column appears on the chart, where the cells “O” will be displayed. In this case, X and O never appear in the same column.

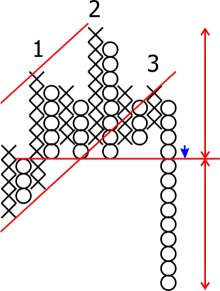
In addition, each graph has a “turn-up threshold” setting, which determines the number of points necessary for the next column to appear, and the graph starts to move in the opposite direction (down if the previous column was X and up if the previous column was O). Only when the reversal threshold is overcome by the price, next to the previous one a new column is drawn, only moving in the opposite direction.
Thus, if the security is moving, for example in the upward trend, the until it passes down the distance a reversal threshold (typically several cell acts as a threshold size, e.g., 3) schedules will show the growing column X. Similarly, the column O is displayed.
It is necessary to remember two important specific moments.
- There is no linear time scale on the crosses-toe charts, so each column can be a few minutes, or maybe several days, depending on the nature of the price movement.
- The cell on the cross-toe chart does not show a specific value of the price, on the contrary, it shows a certain range of values that is within the cell’s range.
Signals of the charts Tic-tac-toe (Point and Figure)
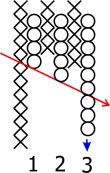
Signals of the trend reversal.
- The emergence of a new column O is a signal for sale
- The appearance of a new column X is a signal to buy.
Support and Resistance Levels
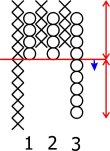
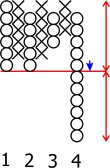
Because of the features of the Tic-Tac-Toe graphs, support and resistance levels are always horizontal lines. The level of support appears on the cross-toe chart if there is a series of consecutive columns O, whose minima are on the same level.
The resistance level appears on the graph crosses and toes if there is a series of consecutive columns X whose maxima are at the same level
It should be remembered that the XO chart points not to a certain level but to the support zone (equal in size to the cell size), since the location of the minima of several columns O at one level does not mean that prices stopped at this level, and indicates only that they did not go below more than one cell. The same applies to resistance levels
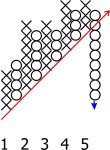
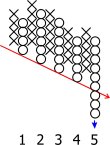
Trendlines
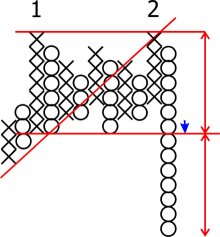
Because of the characteristics of the tic-tac-toll charts, support and resistance levels are always lines with a slope of 45 degrees.
It should be noted that the current position of the trend line on the cross-ticks schedule will in most cases not coincide with the position of the same line of bars and candles on the chart. The reason here is that, firstly, the cross-toe chart does not reflect the actual minimums and maximums of the market, but indicates their position only in the cell range, and secondly, the time scale is nonlinear.
Patterns on the charts Point and Figure
Double top
Triple top
Break of the trading range
Head-shoulders
Decreasing triple top
Breakout of an upward trend line
Acceleration of a downward trend
Rectangle
All of the above patterns have their own mirror images for breakouts up.
Advantages of the Tic-Tac-Toe
- They provide clear signals for buying and selling, without any duality.
- They take into account only “significant” price changes and filter out market noise. In this case, the “significance” of changes is set by the trader.
- Remove the time effect, which sometimes introduces an additional element of uncertainty on ordinary graphs.
- They allow you to determine levels of support and resistance, as well as trend lines.
- They are simple enough to understand
Disadvantages of Tic-Tac-Toe
The charts give good signals only for medium and long-term periods and are not intended for short-term trading.