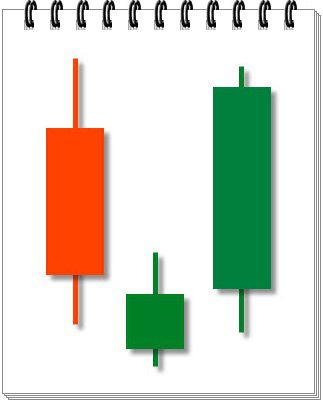
Different types of Japanese Candles
In the previous article, we’ve learned the intro and basics of Japanese candles used in technical analysis of charts. In this article, we’ll see different types of Japanese candles; popularly known as Japanese Candles Pattern.
Japanese Candle Pattern Doji
Doji is an extremely important and revealing neutral candle, which can give a very important signal, both in itself and in various combinations. They arise when the price of opening and closing is about the same, so on the chart you see either a Catholic cross, an inverted cross, or a plus.
Ideal doji involves opening and closing prices on the same level, but this is not always the case. Often the price closes in a few pips above or below the opening price, and this is also considered a doji. Like the “Volchok”, the doji signal about indecisiveness in the market and the retention of the status quo. According to Stephen Nison, who pays much attention to these candles, the doji in the cluster of other candles with small bodies are not considered important. At the same time, if you see the doji among the long candles, then this is an occasion to reflect on the impending change.
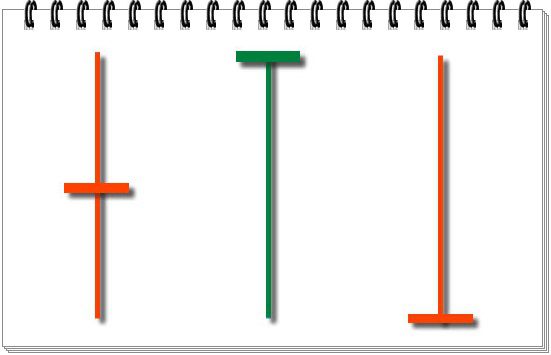
Types of Doji
There are 3 main types of doji: long-legged doji, dragonfly and gravestone (yes, it does not sound very positive). Now about each separately.
Long-legged doji has approximately the same length of the shadow. Such doji most reflect the indecisiveness in the market. Long-legged show that a hot fight was taking place during the bidding, but no one came out victorious, and everything remained in place.
The dozhirkoza appears in the following market situation: during the opening of the candle, sellers dominated, but in the end the buyers made up positions and returned the price to its original value. Looks like a doji dragonfly candle as the letter “T”, with a long shadow at the bottom of the body and no shadow at the top (or very short).
The role in the reversal of the trend of the doji dragonfly depends on the movement of the price before it, as well as the future movement. The long shadow below signals that buyers are beginning to dominate, but that there are still enough sellers on the market. If the doji dragonfly meets at the bottom of a long bearish trend, and ideally, at a support level , then it can give a signal for a trend reversal. If the dragonfly meets at the top of a bullish trend, then there is also a place to expect a price schedule turn. But it is worth remembering that for both options it is necessary to wait for confirmation.
Doji-gravestone is the last of the standard types of doji candles. The candle resembles an inverted “T”, that is, a long upper shadow, and the body is at the bottom, given that the opening and closing prices coincide (or almost coincide). Such a candle tells us that buyers dominated significantly, raising prices up. But by the end of the session, sellers were still able to drive the price down, to the opening price of the deal. As with the doji-dragonfly, the doji-tombstone acts on the same principle, and most often acts as a reversal signal.
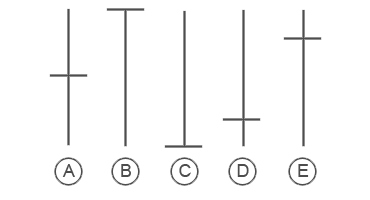
This is the most famous form of candlestick. If the candle is represented by a thin line, this indicates that the price of the opening and closing of the asset are the same, the higher the size of the wick, the more it insinuates a market imbalance.
A: doji simple
When the line is placed in the middle of the wick, it represents an undecided market and is often followed by a pronounced upward or downward movement.
B: doji dragon
The market is often followed by a strong bullish movement when the line is at the high end of the wick.
C: tombstone
The market is often followed by a strong bearish movement when the line is at the lower end of the wick.
D: inverted cross doji
If the stroke is over in the lower part of the wick, the course is more likely to go down.
E: doji cross
If the stroke is over the top of the wick, the course is more likely to move up.
With the doji finished. Now let’s talk about some more important types of Japanese candles.
Hammer and a Hanged man Japanese candles
The hammer is a growing Japanese candle (bull), if it looms after a long bearish trend, we should expect a price turn up. The hammer differs in a small body and a long lower shadow. No matter what color a candle is, the formation itself is important.
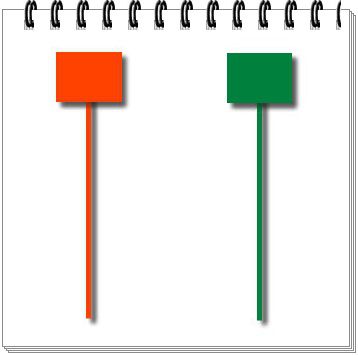
Hammer and a Hanged man Japanese candles
Hangman is a falling Japanese candle, which, after a strong bullish trend, may signal a fall in the price down. Like a hammer, it has a small body and a long lower shadow.
Candlestick Patterns (Combinations)
There is also a large number of combinations (patterns) of candles, which can also be significant in technical analysis.
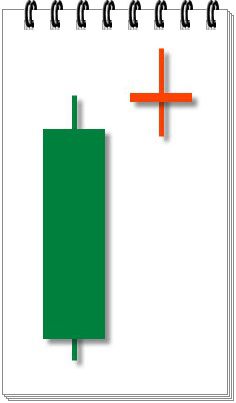
So, for example, there is such a combination of candles as “Star”. Consider “Evening Star” and “morning star” and many others. Let’s consider the basic.
Candles that open with a gap (separation) from the previous candle are called “Stars”. Usually, the previous candle is distinguished by a large body, and so that it “hangs in the air,” as a rule, with a small body. In the role of “Star” can be and tops, hammers and doji of any type, which strengthens the value of the formation.
The evening star
The evening star is a figure of the fall, which can indicate the level of resistance. The combination can signal a trend reversal, especially if the subsequent candle is a long bearish one.
The morning star
The morning star is a growing figure, and the exact opposite of “evening”.
The Doji star, represented in the figure below, implies a candle combination under which, after a rapidly growing candle, opens with a candle-doji gap. As we already know, the star entails a reversal, and the candle of the doji illustrates the indecisiveness in the market. Most often, doji stars lead a trend reversal, but after a certain period of indecision. Before making a trade decision, you should wait for confirmation, as suggested in the examples with morning and evening stars.
The Doji Star
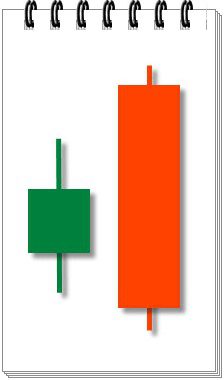
The next combination of Japanese candles is called “Dark Cloud“. If after a growing candle appears a sharp falling, whose closing level is below the middle of a growing candle, then such a figure can signal a trend reversal.
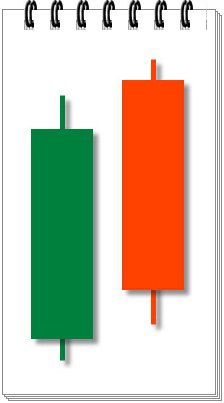
Dark Cloud Candle Pattern
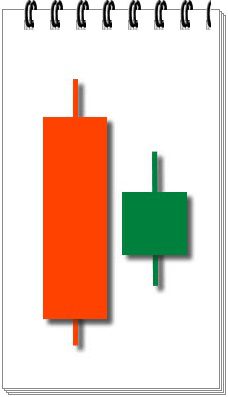
The opposite combination of candles is “Breakdown“. If, after a downtrend, especially after a long bear candle, a long bullish candle appears that opened below the closing price, and closed above the middle of the previous candle, then this is a breakdown. This candlestick pattern, as a rule, signals a price reversal towards the bullish trend.
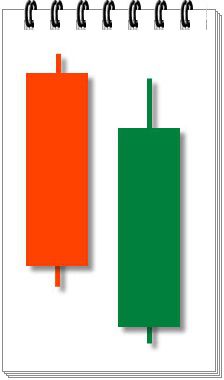
Candlestick pattern “Breakdown”
If, after a long growing trend, a small growing candle is completely covered by a bearish candle, then this combination can symbolize a reversal. Such candles are called falling candles.
Falling Candle Cover
The last to date figure of Japanese candles – “Harami“, which is translated from Japanese as “pregnant.”
Harami
The Japanese candle, which looms within the body of the previous one, is called “Harami”. This combination indicates a decline in the trend potential. The shadows of the second candle do not have to be within the larger candle, but it is preferable when they still do not come out.
For beginning traders, at the initial stages, it is very difficult to notice and apply candlestick patterns and candlestick patterns in time. It takes a considerable amount of time to review and analyze the charts so that the trader’s eyes are accustomed to seeing the full picture of what is happening.
We’ll soon upload free MetaTrader 4 indicator which will show all major candlestick patterns on the chart.
In conclusion, we note that Japanese candles are an excellent illustration of the price chart on the market, and are rightfully enjoyed by traders of all levels. In addition to a simple trend demonstration, Japanese candles can in themselves be signals that a trader can successfully use to make his trading decisions.