Do not buy Gold yet | Technical Chart | 27-Dec-2012
 Below is the technical chart of Gold, using Doda-Donchian and Doda-Bollinger indicators. I’ve also added Kumo component from Ichimoku indicator.
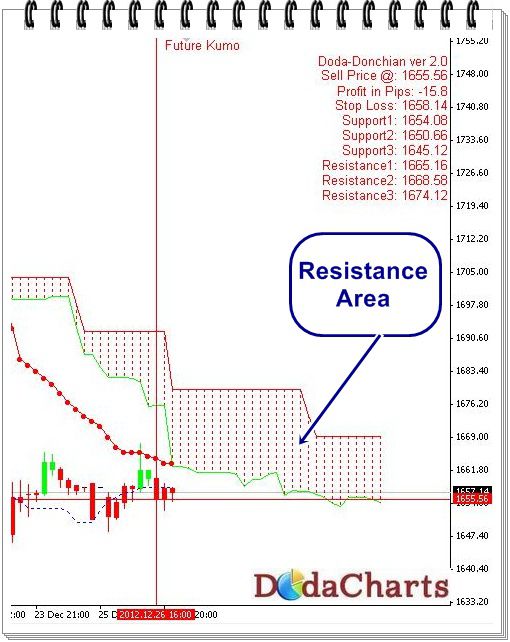
Gold is in downtrend from the last so many trading sessions. It tried to cross Kumo – the main resistance around 11-Dec-2012, but failed to do so. It started its another bear run from there. At the time of writing this article, Gold is trading around $1657.
For this week, Gold needs to cross and close above $1665.17. You can buy Gold at that level but not before that.
On the downside, $1627 and $1597 are the strong support levels.
And on the upside, 1694 and 1732 are the major resistance levels after 1665.
Take your positions accordingly.