Doda Bollinger Bands Indicator for Metatrader4
Bollinger band is one of the famous indicator. But it’s implication of 3 lines confuse sometimes and one can not take proper action on time. So, here is the modified version of Boolinger band. You’ll get single line here.
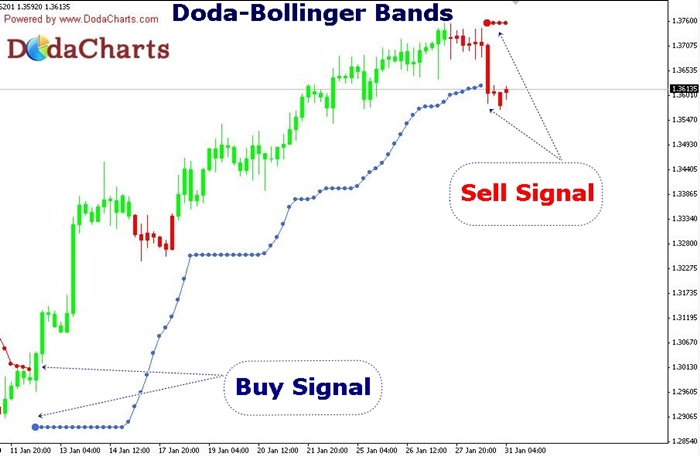
Usage is simple. Buy when price closes above red line and you see blue line. Sell when price closes below blue line and you see red line. The sample image below is self-explanatory. The chart is latest EURUSD pair on H4 time frame. You can easily spot the starting of bull run and now starting of bearish phase.
Lastly, I’ve modified the code to great extent. It was originally by TrendLaboratory. So, the basic coding credit goes to them.
You can download the source code of file from here and compiles file from here.