Dow Jones technical chart | 10 Feb 2011
![]()
This time I’m analyzing the technical chart of Dow Jones using Ichimoku indicator.
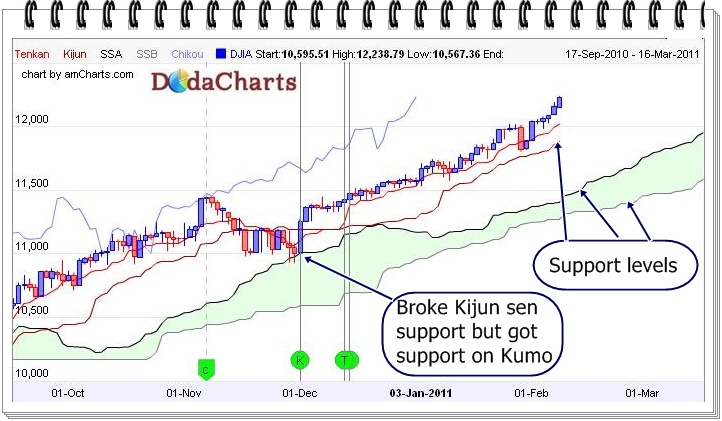
Dow Jones started its bull run in Sept. 2010. The reason is clear as per its technical chart. Around this time, the price & Chikou span (CS) closes above kumo, thus giving bullish breakout. It broke kijun-sen line in Nov 2010 but managed to get support on kumo by the end of the month.
Generally, in bull run, price does not break all levels at one go and kumo also acts as strong support.
In the beginning of Dec 2010, the price again closes above kijun-sen line and resumes its uptrend. Still today, we’re witnessing its bull run.
As long as price is above kijun-sen, one can continue its long-position. If it closes below kijun-sen, one should exit long position and if it breaks kumo support, one can take short-position in the market.