DowJones got support on Kumo | 26-Oct-2011
In the last trading session, DowJones saw a change of -1.7%. Let us see its technical chart using Ichimoku indicator.
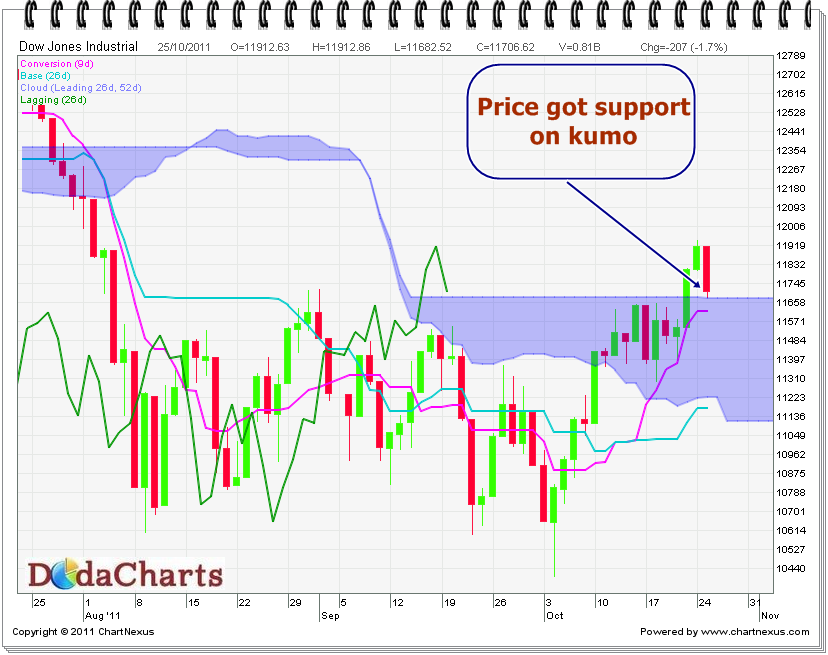
As you can see clearly on the above chart, price touched the level of kumo 11682, which itself is a line of kumo. That means, kumo level is acting as a string support for DowJones. And till DowJones is above this level, we’re in bullish market. It’s time to take long position here with a stop loss of kumo figure. If it closes below this level, it’s advised to close your positions and sit on cash. Simple strategy!