DowJones Technical Chart | 05-Dec-2011
Below is the technical chart of DowJones with ichimoku kinko hyo indicator.
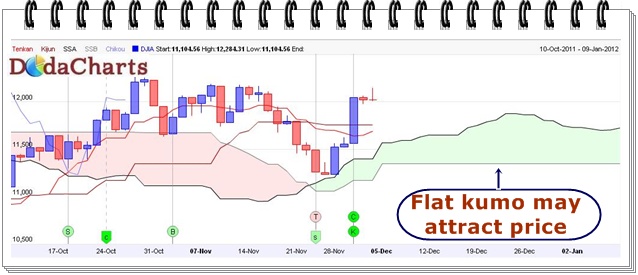
DowJones is trading above kumo, so we can confidently say that it is in bull phase. But the immediate visible problem is that kumo below lime (i.e. Senkou Span B) line is flat. This is not a good signal for this rally.
Whenever there is a flat line in the whole ichimoku system, it will attract the price.
Now, this time, the flat line is down. So the in the next few trading sessions, do not take long positions till this flat line turns upward. Otherwise, DowJones will surely kiss the mark of 11300.