DowJones Technical Chart | 09-May-2012
Below is the technical chart of DowJones, using Ichimoku kinko hyo indicator.
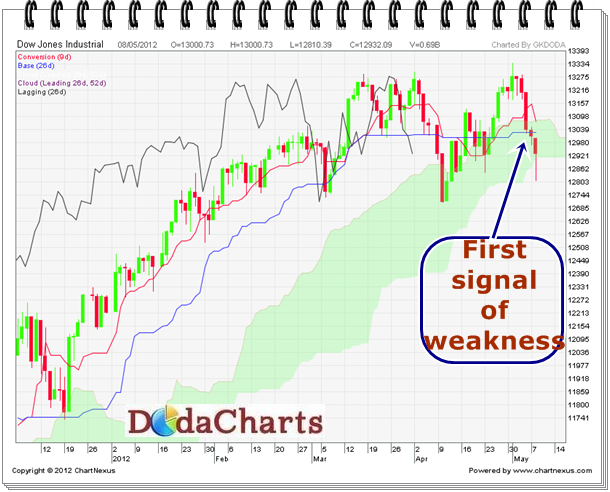
In the last trading session, DowjOnes has closed below kijun-sen line. That is the first signal of its weakness and suggestiont o book profits and sit on cash. Although it managed to close above kumo, so I’m not suggesting to take short positions here. One can take short positions when it and chikou-span closes below kumo. Will expalin that even also later, as and when happens.