DowJones Technical chart | 14-Dec-2011
Let us analyze the technical chart of DowJones Industrial using Ichimoku indicator. I’ve used below weekly time frame to get better picture of support and resistance levels.
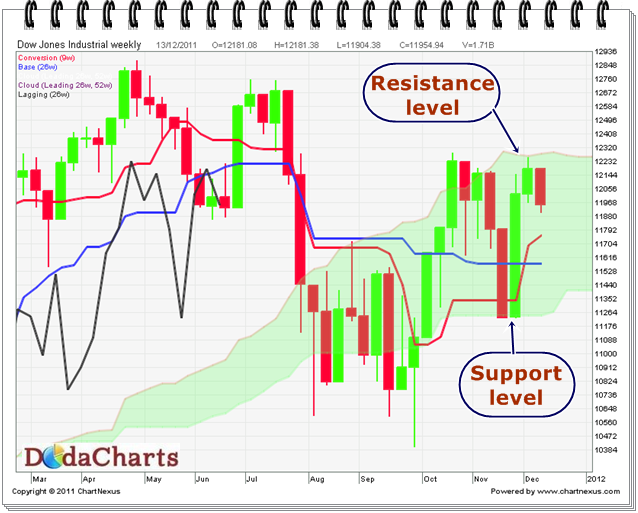
DowJones is not able to cross the levels of 12271 which is the resistance as defined by kumo. On the downside, the immediate support level is at 11577, which is kijun-sen level on weekly chart. Further downside, the support is at 11396. Make your last stop-loss at this level. After that, it’s bearish mode.