DowJones Technical chart | 22-Dec-2011
Below is the technical chart of DowJones using ichimoku kino kuo indicator on weekly time frame.
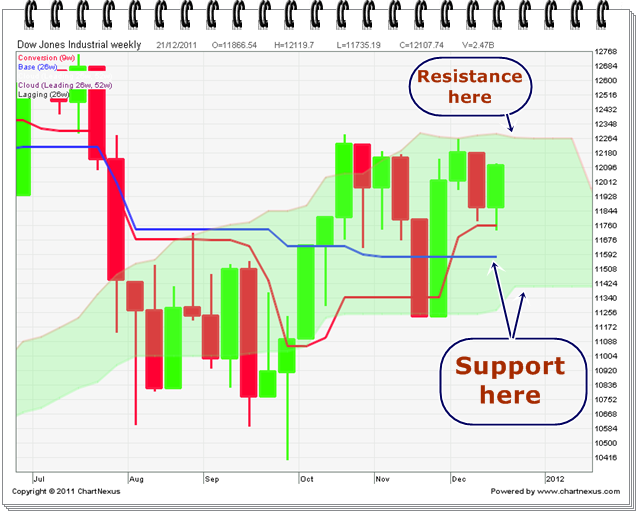
On a weekly chart, DowJones is trading inside kumo which is a no trade zone. It’s better to sit on cash and wait for the right direction at this moment. On the upper side, it needs to close above kumo on weekly time frame to begin bull run. This resistance is at 12264. And on the downside, it will find support at kijun-sen line and then on kumo which are 11578 and 11400 respectively. So, take your positions accordingly.