DowJones technical chart | 24-Nov-2011
Here is a weekly technical chart of DowJones with Ichimoku Kinko Hyo indicator.
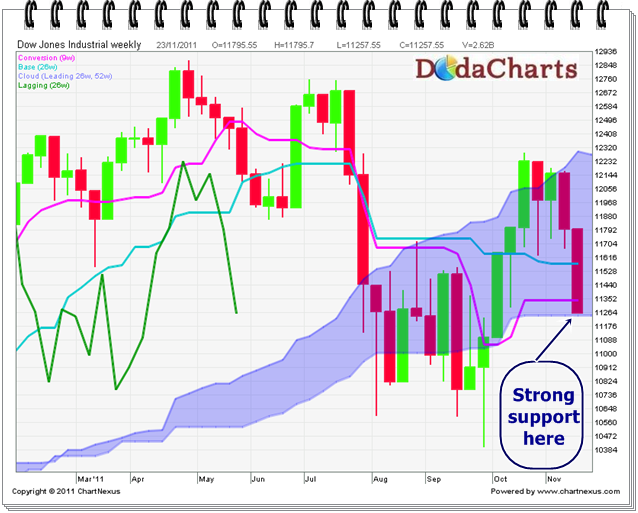
After yesterday’s fall, DowJones took support near kumo, which is a VERY strong support level on weekly chart. It should bounce back from here. Otherwise, one negative news could bring down below kumo and it will start downtrend from here. So, watch this level very carefully and make strict stop-loss around 11240 levels.