DowJones Technical Chart | Updated | 07-July-2011
![]() Just few days back, I’ve uploaded technical chart of DowJones giving bearish signal. Now, after just few trading sessions, the price has moved upward, resulted in the change of chart. The updated chart is below.
Just few days back, I’ve uploaded technical chart of DowJones giving bearish signal. Now, after just few trading sessions, the price has moved upward, resulted in the change of chart. The updated chart is below.
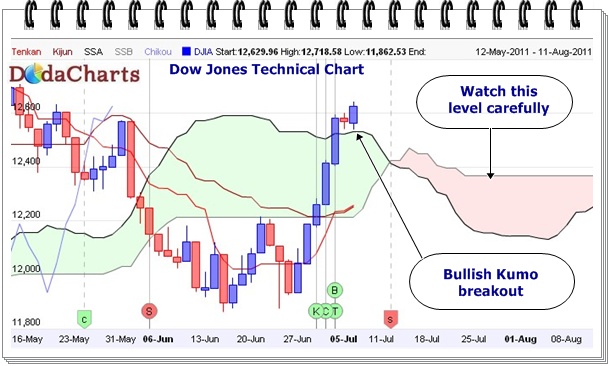
The price closed above kumo, and so is chikou span line (CS). That gives bullish kumo breakout. But main point here to watch in coming days is that price may come back to level of 12380-12400 as that is the falt kumo.
Whenever kumo line is flat, it will attract price.
So, watch that level carefully before you initiate any trade.