DowJones technical chart |12-Sep-2011
Here is the current technical chart of DOWJones using ichimoku indicator.
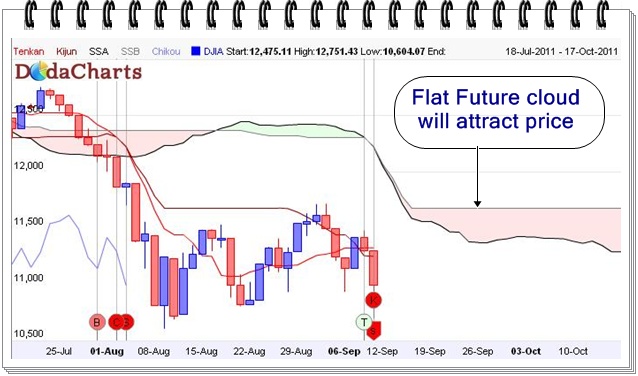
As mentioned in my previous post on DowJones on 22-Aug-2011, when it was trading near 10854 levels, I wrote that it might go to the level of 11,600 in coming days. It closed at 11,613 few trading sessions back and thereafter resumes its downward journey. At this point, all the technical factors suggests further downtrend except one Senkou Span A line, which is now future cloud of Ichimoku.
I’ll explain more on future cloud component of Ichimoku on some other day. For the time being, just understand, that when Future cloud line is flat, it will attract price. So, I suggest not to take any further short positions and one single positive news in USA will trigger the price to the level of 11600 levels again. Bullish cross of Tenkan Sen and Kijun sen can also be noted down.