DowJones technical chart with Ichimoku Kinko Hyo | 11-Oct-2011
Below is the explanation of DowJones technical chart with Ichimoku Kinko Hyo indicator
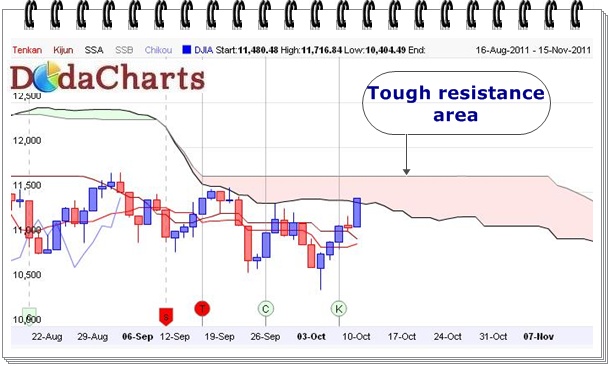
In the last trading session, DowJones closed @11433.18 and it may be seen bullish pattern from the last 4-5 trading sessions. But wait. As seen in the above chart, its price is trading near kumo area of Ichimoku indicator, which is a huge resistance area.
If you remember, DowJones tried to cross this kumo before also on around 16-Sep-2011 to 21-Sep-2011, but it failed then and price came down considerably from there.
So, one must take long call in this indice if and ONLY if the price CLOSES above kumo viz. around 11550 – 11600 area.