Ebay Technical chart | Nasdaq | 02-Dec-2011
Let’s discuss the technical chart of Ebay, listed on Nasdaq. I’ve using Ichimoku Kinko Hyo indicator.
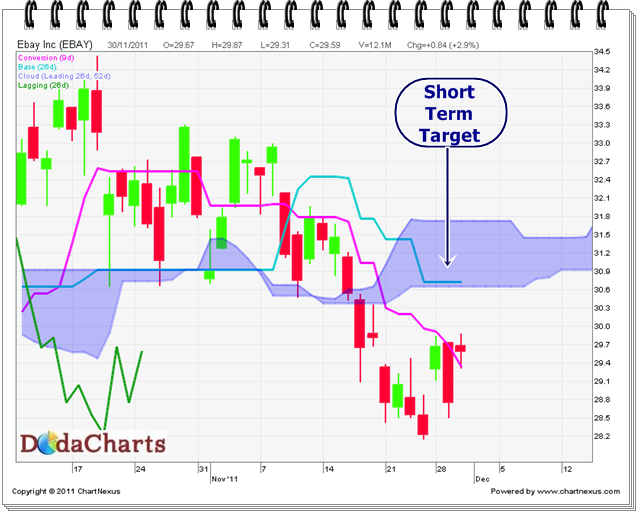
The only positive sign in this chart is that kijun-sen line is flat. So, near term target for this stock is 30.72, where it will face resistance. One must book profit at that level.