EOG Resources Technical Chart | NYSE | 03-Dec-2011
 Below is the technical chart of EOG Resources listed on NYSE, with Ichimoku Kinko Hyo indicator. I’ve used weekly time frame on chart.
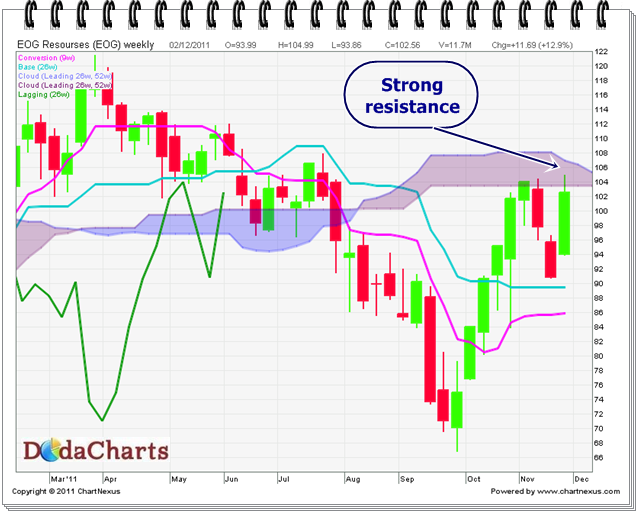
The weekly chart clearly represents support and resistance, which daily time frame misses sometimes. The price of this stock is trading near kumo, which itself is a very high resistance zone. The positive point here is Chikou-Span (CS) line is already above kumo. So, if the price also closes above kumo, the stock will start its bull run. Watch the level of 105.40 carefully for that. On the downside, support is at 94.42 and then at 89.44.