EURUSD Daily Technical Chart 07-Nov-2017
EURUSD Daily Technical Chart » 07-Nov-2017
Below is the technical chart of EURUSD. Previously, I'd discussed technical charts with Doda Donchian, Doda-Bollinger Bands, Ichimokuand ADX Candles technical indicators, but this time, for a change, I've not used any technical indicators.
I've just used Japanese Candlestick Chart. Time Frame taken is Daily.
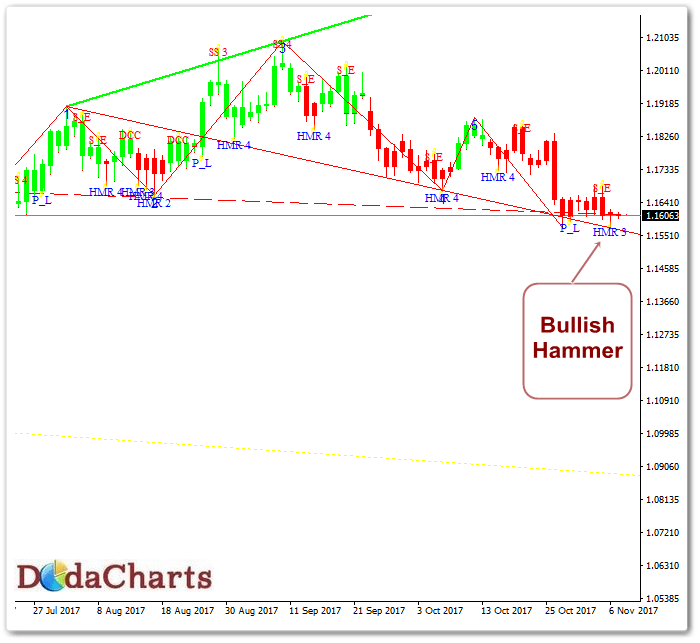
As seen clearly on the chart above, a Bullish Hammer has been formed on yesterday's chart. That means EURUSD will rise from these levels in a day or two.
Now, watch EURUSD technical chart on H4 time frame and wait for Buy signal by Doda Donchian, MACD and Doda Bollinger Bands. When they confirm buy signal, take a long position in EURUSD.
Note: There is a complete tutorial on MACD. Go through that and download MACD indicator for MetaTrader 4. You'll love that indicator.