EURUSD Forex Technical Chart | 06-Sep-2017
Today, we're going to analyze the technical chart of EURUSD currency pair. I'm using time frame H4 on Doda Donchian, Doda BollingerBands and Ichimoku technical indicators.
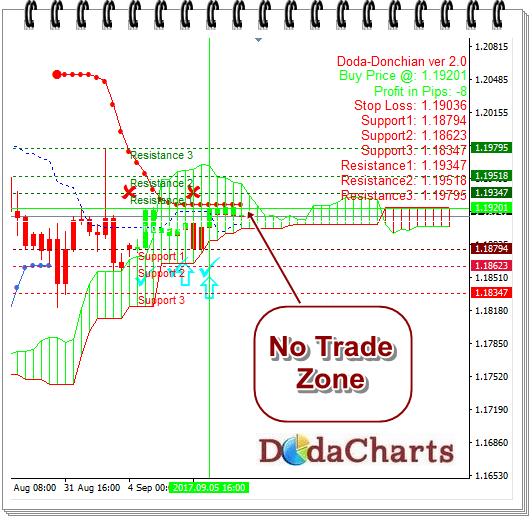
EURUSD Technical Chart
At the time of writing this article, EURUSD currency pair is trading @1.19616. Looking at Ichimoku indicator, it's clear that it is trading INSIDE cloud of Ichimoku indicator - which is termed as NO trading zone.
So, just wait and watch at this moment. It should either close above or close below the cloud to get the clear trend.
So, in next few hours, if it closes above 1.19344, take a long call on it.
On the other hand, if it closes below 1.18785, take the short call.
Important Support and Resistance Levels are:
Support Levels:
1.18794
1.18623
1.18347
Resistance Levels:
1.19347
1.19518
1.19795
I hope you understand my trading strategy with this article. If you've any doubts, please share in the comments section below.