EURUSD Technical Chart 02-Oct-2017
Below is the technical chart of EURUSD currency pair explained with technical indicators.
EURUSD Technical Chart
I've used Doda Donchian, Doda-Bollinger Bands, Ichimokuand ADX Candles in this chart. Time frame used is H4.
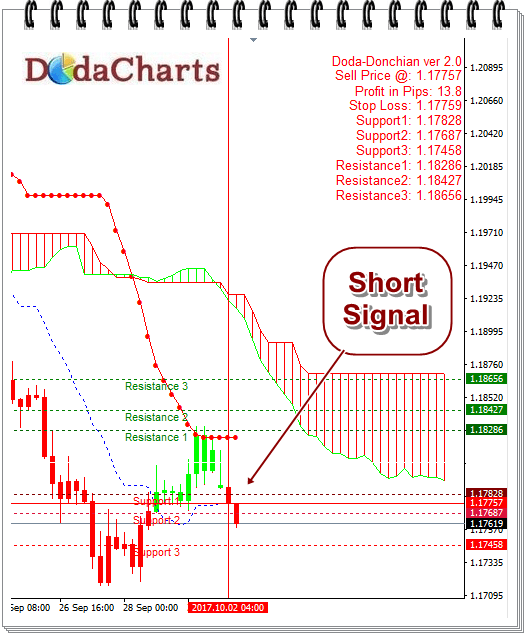
After touching low of 1.1715 on 27-Sep-2017, EURUSD currency pair started its upward journey. But that journey was short-lived as it was trading below Ichimoku cloud.
So, after facing tough resistance from Doda Bollinger Bands, it started its downtrend journey again, which was confirmed by Doda-Donchian @1.17757
So, it's time to short sell in this currency pair.
Major support and resistance levels are:
Support @:
1.17828
1.17687
1.17458
Resistance @:
1.18286
1.18427
1.18656
Make your stop loss @1.17759