EURUSD Technical Chart 03-Oct-2017
Below is the EURUSD Technical Chart currency pair explained with technical indicators.
EURUSD Technical Chart
I’ve used Doda Donchian, Doda-Bollinger Bands, Ichimokuand ADX Candles in this chart. Time frame used is H4.
As suggested in my yesterday's post, EURUSD started its downtrend journey as all our signals confirmed that one-by-one. So, that was calculated risk.
You might be wondering why I am still saying it as "risk"?
The answer is even if all your tested technical indicators confirm the signal, this forex market is very very volatile and unpredictable. No can be sure 100% at any stage of ticking. One has to take risk to make money.
But that risk should be well calculated in advance rather than playing gambling.
Ok. Back to our technical chart of EURUSD.
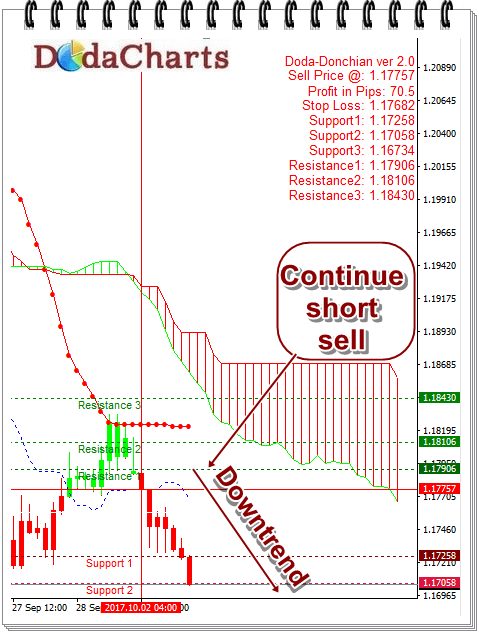
At the time of writing this article, EURUSD is taking rest at support level 2 of today which is @1.17058; that means a profit of 69.7 pips from yesterday article recommendation.
What next?
First, make a stop loss of 1.17682
Continue with your short sell. Do not take fresh short sell entry at this stage. It may touch its support level 3.
Next support and resistance levels are:
Support levels:
1.17258
1.17058
1.16734
Resistance Levels:
1.17906
1.18106
1.18430