EURUSD Technical Chart 10 Dec 2010
This is one of the example to use Doda-Donchian and Ichimoku indicator together.
From the last couple of days, we've witnessed range-bound price movement in EURUSD currency chart. Still, no one knows which position to take. The solution lies in Ichimoku indicator.
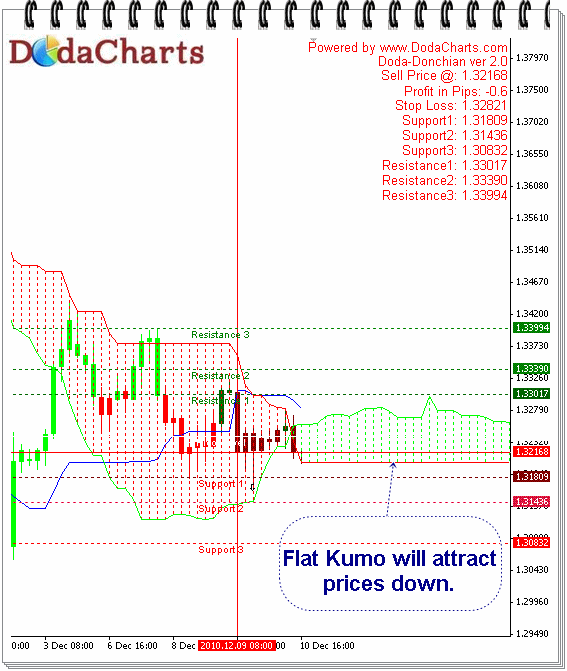
I've plotted Doda-Donchian and Ichimoku indicators in above chart. Just look at Kumo in the chart. The bottom line is flat. As explained in many of my previous posts,** flat lines will always ATTRACT price.** So, in this case, chart suggests that price will come down in coming days. So, avoid any long position till the price closes above kumo i.e. 1.33017 and confirmed by Doda-Donchian.