EURUSD Technical Chart 11-Oct-2017
Below is the EURUSD Technical Chart currency pair explained with technical indicators.
EURUSD Technical Chart
I’ve used Doda Donchian, Doda-Bollinger Bands, Ichimokuand ADX Candles in this chart. Time frame used is H4.
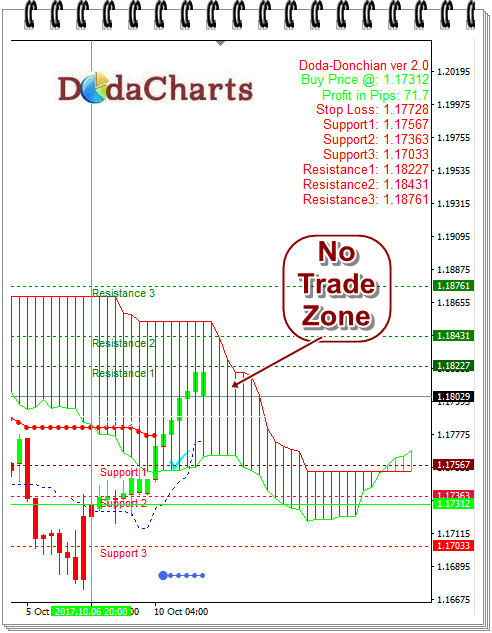
As clearly visible in above image, Doda Donchian indicator gave Buy signal @1.17312 and it gave profit of apporox. 68 pips by then.
The same call was confirmed by Doda-Bollinger bands too.
But shall one take such call?
Let us examine in detail.
The BUY signal was given when EURUSD was trading below Ichimoku cloud. That means such calls are risky ones. One should NOT take any Buy call when a currency pair is trading below Ichimoku cloud.
Currently, EURUSD is trading inside Ichimoku cloud - which is "No trade" zone.
Although with current pattern, EURUSD is likely to touch 1.18425, where it will face tough resistance. But still, I would wait to tarde this currency pair EURUSD either above Ichimoku cloud or below this cloud.
Support Levels for today are:
1.17567
1.17363
1.17033
Resistance Levels for today are:
1.18227
1.18431
1.18761
Stop loss should be @1.17728