EURUSD Technical Chart 13-Oct-2017
Below is the EURUSD Technical Chart currency pair of 13-Oct-2017 explained with technical indicators.
EURUSD Technical Chart
I’ve used Doda Donchian, Doda-Bollinger Bands, Ichimokuand ADX Candles in this chart. Time frame used is H4.
In the last article, I suggested to ignore trading EURUSD as at that time, it was trading inside kumo, which is a NO trade zone.
But things have changed now.
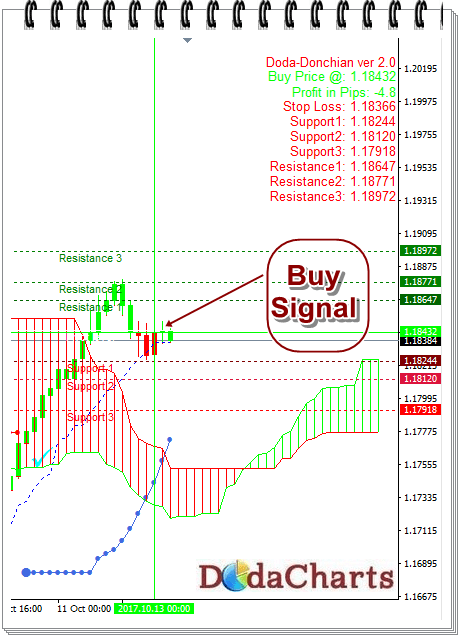
Now, EURUSD currency pair is trading ABOVE kumo cloud of Ichimoku indicator and also above Doda-Donchian and Doda-Bollinger Bands.
So, one can take long call in EURUSD currency pair.
So, buy [email protected] with a stop loss of 1.18366
Support Levels are:
1.18244
1.18120
1.17918
Resistance Levels are:
1.18647
1.18771
1.18972