EURUSD Technical Chart 16-Oct-2017
Below is the EURUSD Technical Chart currency pair of 16-Oct-2017 explained with technical indicators.
EURUSD Technical Chart
I’ve used Doda Donchian, Doda-Bollinger Bands, Ichimokuand ADX Candles in this chart. Time frame used is H4.
 EURUSD Technical Chart
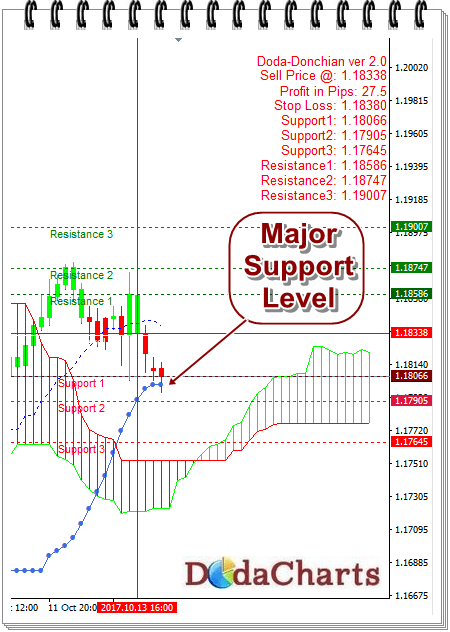
After facing resistance @1.18747 and then @1.18586, EURUSD is taking support @1.18011. This support level is also the support level of Doda Bollinger Bands.
So, shall we take any long call at this level?
NO
Let us find out the technical reasons for this.
Doda Donchian indicator already gave sell signal @1.18338. But since the price is trading above Ichimoku cloud Kumo and Doda Bollinger bands, one can confidently say that this is a false signal. So, just stay away from this currency pair for the time being.
Major Support Levels are:
1.18066
1.17905
1.17645
Major Resistance Levels are:
1.18586
1.18747
1.19007