EURUSD Technical Chart 18-Oct-2017
Below is the EURUSD Technical Chart currency pair of 18-Oct-2017 explained with technical indicators.
EURUSD Technical Chart
I’ve used Doda Donchian, Doda-Bollinger Bands, Ichimokuand ADX Candles in this chart. Time frame used is H4.
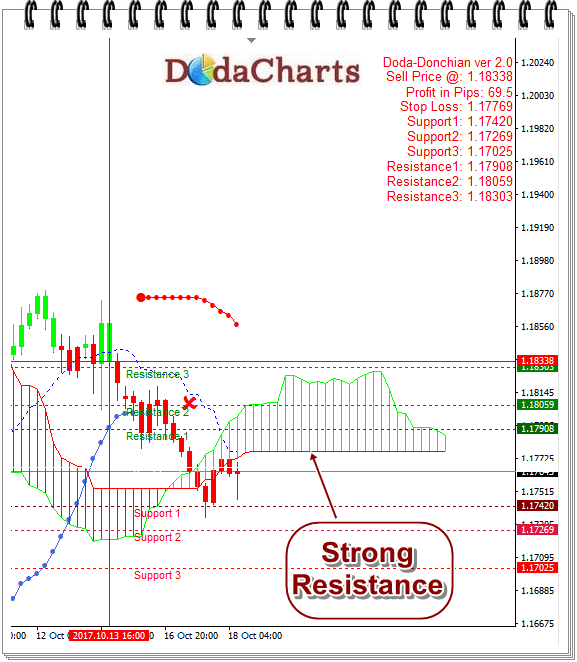
EURUSD currency pair started its downtrend from 1.18338. It was expected as Future Kumo was flat from the bottom at that time. Flat kumo always attracts the price. That is one of the golden rule of Ichimoku indicator.
Now, after touching its support level 1 @1.17420, EURUSD is currently trading near kumo. To get upside, it has to cross Kumo level 1.17768 - 1.8299, which has become its strong resistance now.
So, if it breaks its support level of 1.17420, one can initiate fresh short position.
Major Support Levels are:
1.17420
1.17269
1.17025
Major Resistance Levels are:
1.17908
1.18059
1.18303