EURUSD Technical Chart 23-Oct-2017
Below is the EURUSD Technical Chart currency pair of 23-Oct-2017 explained with different technical indicators.
EURUSD Technical Chart
I’ve used Doda Donchian, Doda-Bollinger Bands, Ichimokuand ADX Candles in this chart. Time frame used is H4.
 EURUSD Technical Chart
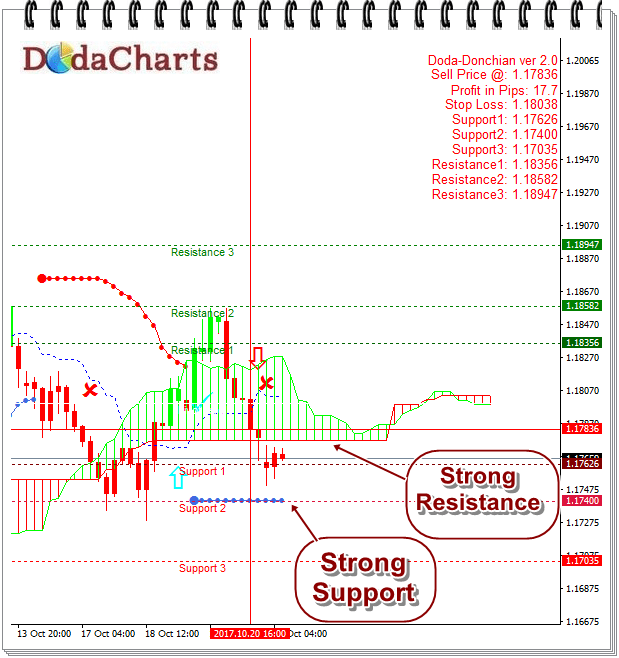
EURUSD has formed a very interesting pattern on the technical chart. Different technical indicators have already given Sell signal on this currency pair.
Doda-Donchian has given sell signal @1.17836
The curreny pair is already trading below kumo cloud of Ichimoku; thus chances of moving downwards are very strong. Kumo level of 1.17768 has become strong resistance now.
MACD indicator has also given sell signal.
The only waiting indicator in the list is Doda Bollinger bands. It's still giving support to EURUSD @1.17400, which interestingly coincides with Fibonacci retracement support level.
Thus, 1.17400 has become very strong level for today's trading. It should cross it and CLOSE below this level to initiate short sell on EURUSD.
Major Support Levels:
1.17626
1.17400
1.17035
Major Resistance Levels:
1.18356
1.18582
1.18947