EURUSD Technical chart | 06-Sep-2013
 Below is the technical chart of EURSD for 06-Sep-2013 on H4 time frame using few technical indicators.
All the indicators used in this chart can be downloaded free of cost from the download section of this website. These indicators are for MetaTrader 4 terminal.
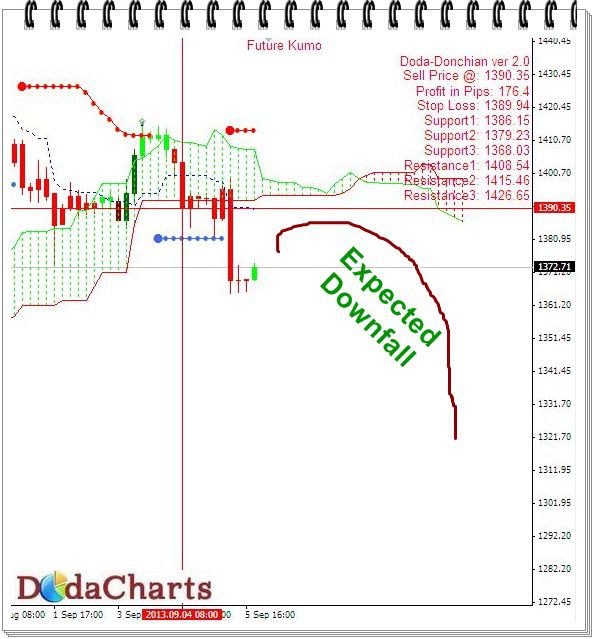
On 29-08-2013, our technical indicators gave sell signal on EURUSD @1.3328. Since then, it started its downward journey and at the time of writing this article, it was trading at 1.3135.
It can move few pips up from this level, but it will eventually fall to 1.3034 in coming trading sessions.
1.3260 is the major resistance for this week.