EURUSD Technical chart | 07-Nov-2011
Here is a technical chart of EURUSD with Ichimoku indicator. I’ve removed all the components of Ichimoku here except Kumo. The first chart is at H1 time frame and 2nd is on H4 time frame.
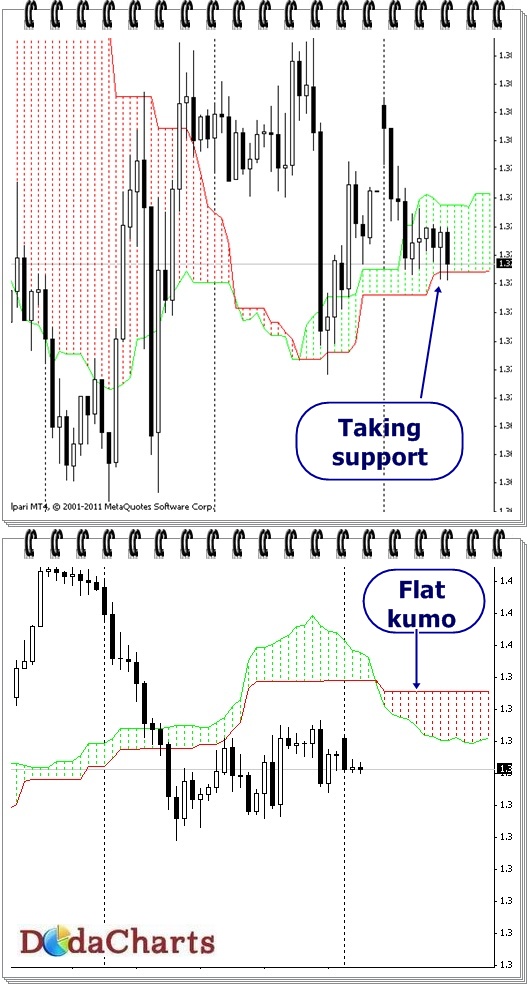
On H1 time frame, EURUSD is trading inside kumo, which is no trade zone. It can move 50-60 pips down from here to get support. But if you look at H4 time frame, the future kumo is flat, which can attract the price to the level of 1.3927. Watch this range carefully.