EURUSD Technical Chart | 18-June-2014

Below is the technical chart of EURUSD on H4 time frame.
The trend of this chart is down from from time. It tried to cross to resistance around 1.3654 around 5-8 June, 2014 but it failed there.
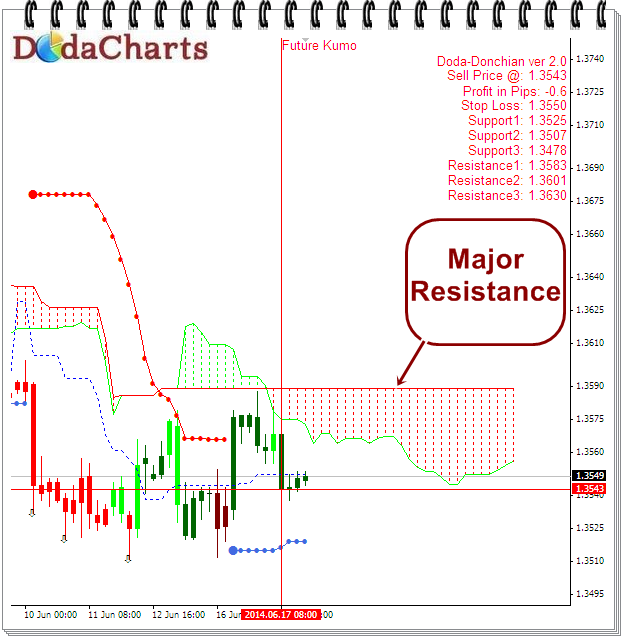
Now, the future kumo has become flat and it’s calling price to start uptrend. But for that, it needs to cross AND close above 1.3590. So, do not take any long call below 1.3590.
If it manages to do so, it will start fresh uptrend.
Below that, 1.3479 is clearly visible support and immediate target.